Overview
This strategy calculates the CMO indicator and rate of change to dynamically plot support lines. Trading signals are generated when price breaks through the support lines. Meanwhile, the strategy also optimizes the stop loss range around support lines to lock in more profits.
Strategy Logic
- Calculate the CMO indicator to determine price trend
- Calculate rate of change Var to reflect price change trend
- Plot support line based on rate of change
- Calculate optimized stop loss lines longStop and shortStop
- Generate trading signals when price breaks support line
Advantage Analysis
- Use CMO indicator to determine price trend and avoid false breakouts
- Support line clearly indicates trend direction
- Optimized stop loss locks in more profits
- Clear and simple trading signals, easy to follow
Risk Analysis
- CMO indicator has lagging effect, may miss price turning points
- Breaks of support line may generate false signals
- Improper stop loss optimization may lead to larger losses
Risk Solutions:
1. Adjust CMO parameters properly to reduce lagging
2. Add more filters with other indicators to avoid false signals
3. Test to determine suitable stop loss optimization ratio
Optimization Directions
- Add more indicators to filter out false signals
- AI automated optimization of stop loss range
- Auto adjust trading size
Summary
Overall this strategy works well, using support line to clearly determine trend direction. Combined with CMO indicator and optimized stop loss it achieves good results. But there are some risks of false signals, which can be improved by combining more indicators.
Strategy source code
/*backtest
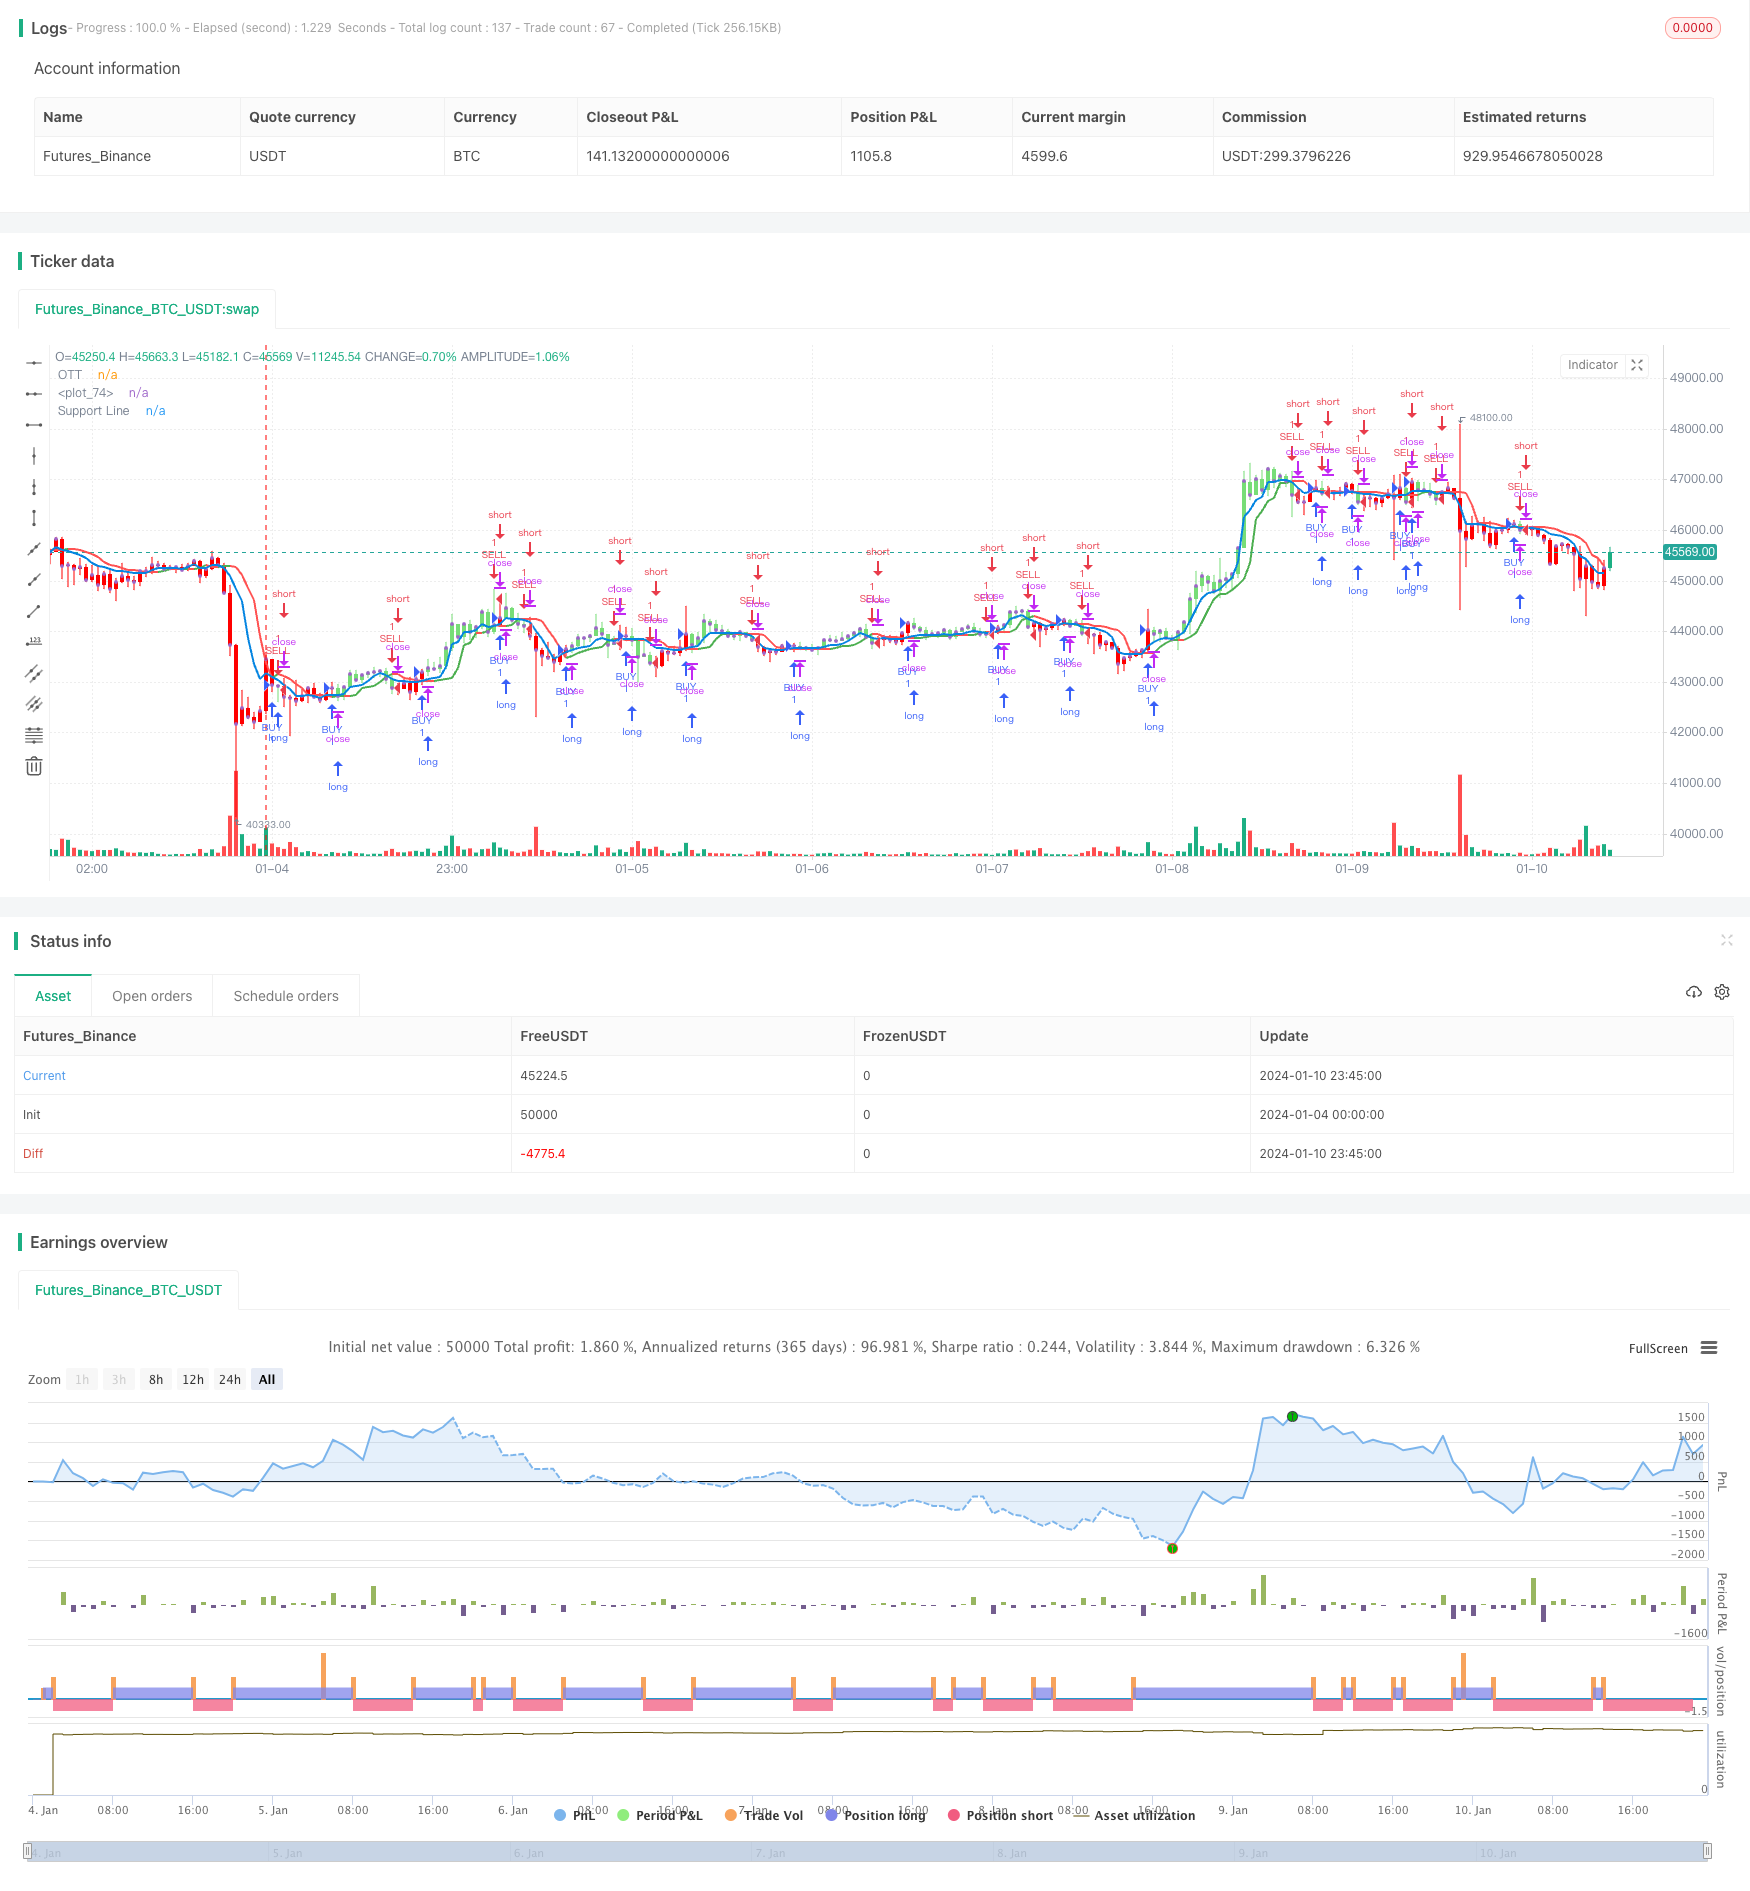
start: 2024-01-04 00:00:00
end: 2024-01-11 00:00:00
period: 45m
basePeriod: 5m
exchanges: [{"eid":"Futures_Binance","currency":"BTC_USDT"}]
*/
// This source code is subject to the terms of the Mozilla Public License 2.0 at https://mozilla.org/MPL/2.0/
// © melihtuna
//@version=4
strategy("Optimized Trend Tracker - Strategy Version", shorttitle="OTT-Strategy", overlay=true, default_qty_type=strategy.percent_of_equity, default_qty_value=100, initial_capital=10000, currency=currency.USD, commission_value=0.1, commission_type=strategy.commission.percent)
src = input(close, title="Source")
pds=input(1, "OTT Period", minval=1)
percent=input(0.1, "OTT Percent", type=input.float, step=0.1, minval=0)
condition = input(title="Condition", defval="Support Line Crossing Signals", options=["Price/OTT Crossing Signals", "Support Line Crossing Signals"])
showsupport = input(title="Show Support Line?", type=input.bool, defval=true)
highlight = input(title="Show OTT Color Changes?", type=input.bool, defval=true)
highlighting = input(title="Highlighter On/Off ?", type=input.bool, defval=true)
barcoloing = input(title="Barcolor On/Off ?", type=input.bool, defval=true)
showlabels = input(title="Show OTT BUY/SELl Labels?", type=input.bool, defval=false)
// === INPUT BACKTEST RANGE ===
FromMonth = input(defval = 1, title = "From Month", minval = 1, maxval = 12)
FromDay = input(defval = 1, title = "From Day", minval = 1, maxval = 31)
FromYear = input(defval = 2020, title = "From Year", minval = 2017)
ToMonth = input(defval = 1, title = "To Month", minval = 1, maxval = 12)
ToDay = input(defval = 1, title = "To Day", minval = 1, maxval = 31)
ToYear = input(defval = 9999, title = "To Year", minval = 2017)
// === FUNCTION EXAMPLE ===
start = timestamp(FromYear, FromMonth, FromDay, 00, 00) // backtest start window
finish = timestamp(ToYear, ToMonth, ToDay, 23, 59) // backtest finish window
window() => time >= start and time <= finish ? true : false // create function "within window of time"
alpha=2/(pds+1)
ud1=src>src[1] ? src-src[1] : src
dd1=src<src[1] ? src[1]-src : src
UD=sum(ud1,9)
DD=sum(dd1,9)
CMO=(UD-DD)/(UD+DD)
k= abs(CMO)
Var=0.0
Var:=(alpha*k*src)+(1-alpha*k)*nz(Var[1])
fark=Var*percent*0.01
longStop = Var - fark
longStopPrev = nz(longStop[1], longStop)
longStop := Var > longStopPrev ? max(longStop, longStopPrev) : longStop
shortStop = Var + fark
shortStopPrev = nz(shortStop[1], shortStop)
shortStop := Var < shortStopPrev ? min(shortStop, shortStopPrev) : shortStop
dir = 1
dir := nz(dir[1], dir)
dir := dir == -1 and Var > shortStopPrev ? 1 : dir == 1 and Var < longStopPrev ? -1 : dir
MT = dir==1 ? longStop: shortStop
OTT=Var>MT ? MT*(200+percent)/200 : MT*(200-percent)/200
plot(showsupport ? Var : na, color=#0585E1, linewidth=2, title="Support Line")
OTTC = highlight ? OTT[2] > OTT[3] ? color.green : color.red : #B800D9
pALL=plot(nz(OTT[2]), color=OTTC, linewidth=2, title="OTT", transp=0)
buySignalk = window() and crossover(Var, OTT[2])
sellSignallk = window() and crossunder(Var, OTT[2])
buySignalc = window() and crossover(src, OTT[2])
sellSignallc = window() and crossunder(src, OTT[2])
plotshape(condition == "Support Line Crossing Signals" ? showlabels and buySignalk ? OTT*0.995 : na : showlabels and buySignalc ? OTT*0.995 : na, title="BUY", text="BUY", location=location.belowbar, style=shape.labelup, size=size.tiny, color=#0F18BF, textcolor=color.white, transp=0)
plotshape(condition == "Support Line Crossing Signals" ? showlabels and sellSignallk ? OTT*1.005 : na : showlabels and sellSignallc ? OTT*1.005 : na, title="SELL", text="SELL", location=location.abovebar, style=shape.labeldown, size=size.tiny, color=#0F18BF, textcolor=color.white, transp=0)
ottBuyColor=#77DD77
ottSellColor=#FF0000
vColor = strategy.position_size > 0 ? ottBuyColor : ottSellColor
if condition == "Support Line Crossing Signals"
strategy.entry("BUY", true, 1, when = buySignalk)
strategy.entry("SELL", false, 1, when = sellSignallk)
else
strategy.entry("BUY", true, 1, when = buySignalc)
strategy.entry("SELL", false, 1, when = sellSignallc)
mPlot = plot(close, title="", style=plot.style_circles, linewidth=0,display=display.none)
longFillColor = highlighting ? (Var>OTT ? color.green : na) : na
shortFillColor = highlighting ? (Var<OTT ? color.red : na) : na
fill(mPlot, pALL, title="UpTrend Highligter", color=longFillColor)
fill(mPlot, pALL, title="DownTrend Highligter", color=shortFillColor)
barcolor(barcoloing ? vColor : na)