Overview
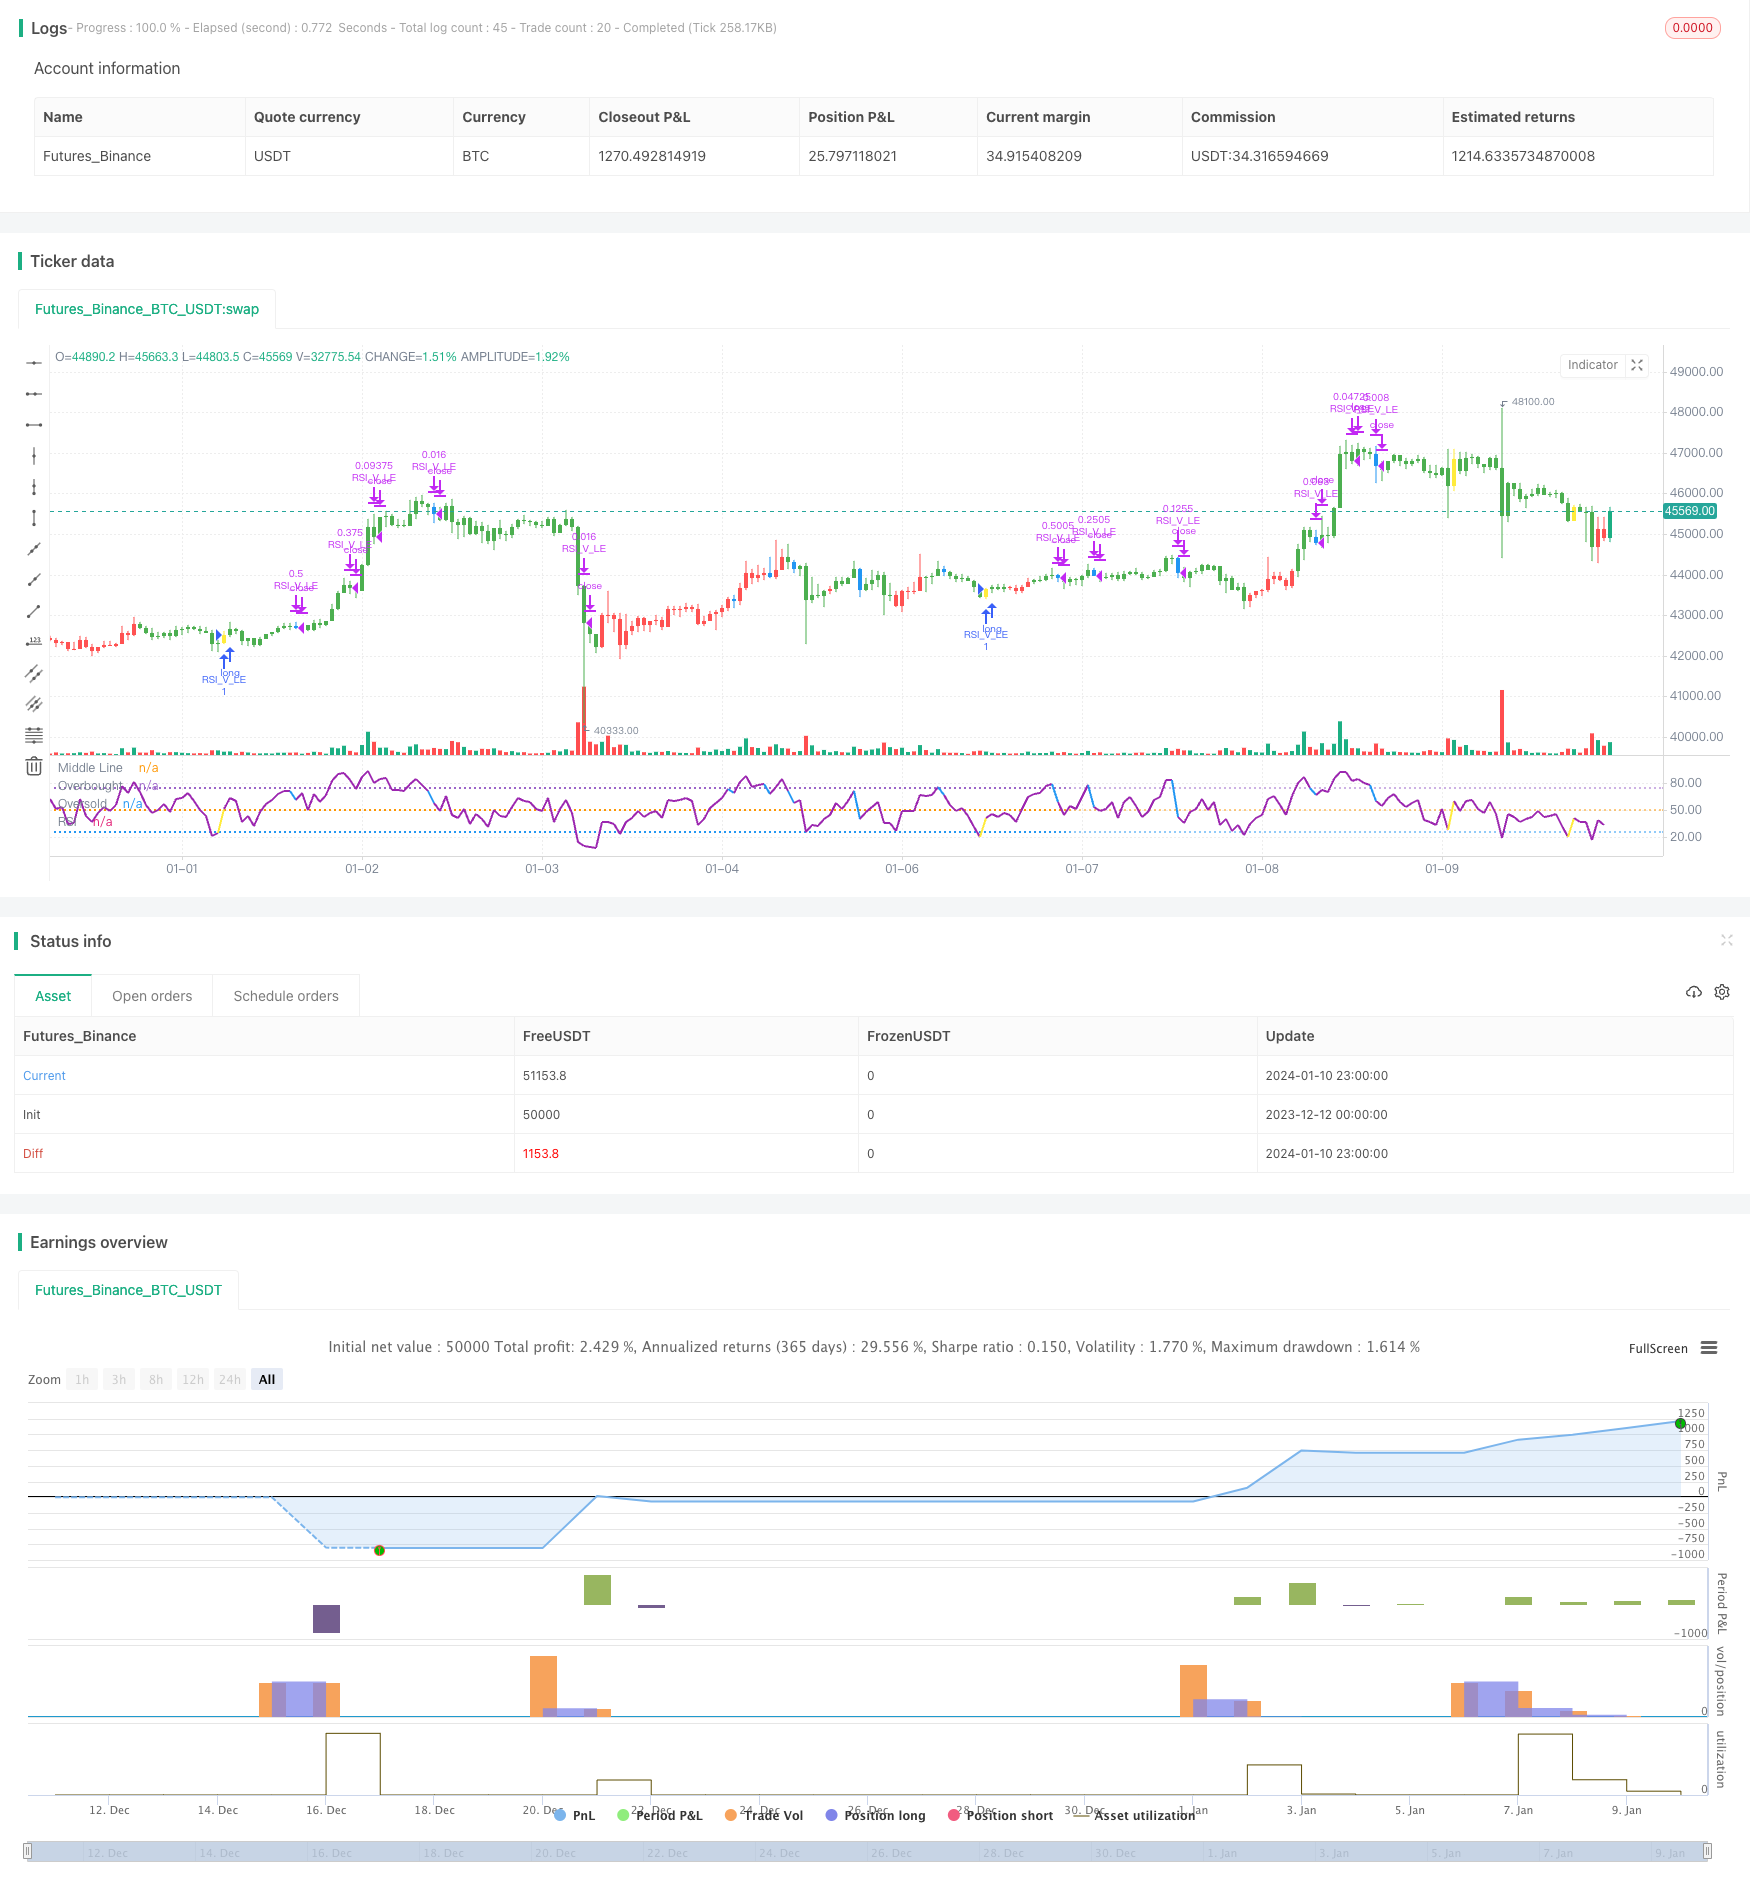
This strategy is based on the V-shaped pattern formed by the RSI indicator, combined with EMA filters, to develop a reliable short-term profitable trading strategy. It captures rebound opportunities when the price is oversold by accurately going long through RSI’s V-shaped signals, for the purpose of making profits in the short run.
Strategy Logic
- Use 20-day EMA above 50-day EMA as the judgment of long-term uptrend
- RSI forms V-shaped pattern, indicating oversold rebound opportunities
- Previous bar’s low is lower than previous 2 bars’ low
- Current bar’s RSI is higher than previous 2 bars’ RSI
- RSI crosses above 30 as the completion signal of V-shaped pattern to go long
- Set stop loss at 8% below entry price
- When RSI crosses 70, start closing positions and move stop loss to entry price
- When RSI crosses 90, close 3⁄4 positions
- When RSI goes below 10 / stop loss triggered, close all positions
Advantage Analysis
- Use EMA to judge overall market direction, avoid trading against the trend
- RSI V-shaped pattern captures mean-reverting opportunities when oversold
- Multiple stop loss mechanisms to control risks
Risk Analysis
- Strong downtrend may incur unstoppable losses
- RSI V-shaped signals may give false signals, leading to unnecessary losses
Optimization Directions
- Optimize RSI parameters to find more reliable V-shaped patterns
- Incorporate other indicators to enhance reliability of reversal signals
- Refine stop loss strategy, balance between preventing over-aggressiveness and timely stop loss
Summary
This strategy integrates EMA filter and RSI V-shaped pattern judgment to form a reliable short-term trading strategy. It can effectively seize the rebound opportunities when oversold. With continuous optimization on parameters and models, improving stop loss mechanisms, this strategy can be further enhanced in stability and profitability. It opens the door of profitable swing trading for quant traders.
Strategy source code
/*backtest
start: 2023-12-12 00:00:00
end: 2024-01-11 00:00:00
period: 1h
basePeriod: 15m
exchanges: [{"eid":"Futures_Binance","currency":"BTC_USDT"}]
*/

// This source code is subject to the terms of the Mozilla Public License 2.0 at https://mozilla.org/MPL/2.0/
// © mohanee

//@version=4
//strategy("RSI V Pattern", overlay=true)
strategy(title="RSI V Pattern", overlay=false )

//Strategy Rules
//ema20 is above ema50  --- candles are colored  green on the chart
//RSI value sharply coming up which makes a V shape ,  colored in yellow on the chart
//RSI V pattern should occur from below 30

len = input(title="RSI Period", minval=1, defval=5)
stopLoss = input(title="Stop Loss %", minval=1, defval=8)

myRsi = rsi(close,len)

longEmaVal=ema(close,50)
shortEmaVal=ema(close,20)

//plot emas
//plot(longEmaVal, title="Long EMA" ,linewidth=2, color=color.orange, trackprice=true)
//plot(shortEmaVal, title="Short EMA" ,linewidth=2, color=color.green, trackprice=true)


longCondition =  ema(close,20)>ema(close,50)   and (low[1]<low[2] and  low[1]<low[3]) and (myRsi>myRsi[1] and myRsi>myRsi[2] ) and crossover(myRsi,30) //  (   and myRsi<60)

//(myRsi<60 and myRsi>30)  and myRsi>myRsi[1] and (myRsi[1]<myRsi[2]  or  myRsi[1]<myRsi[3]) and (myRsi[2]<30)  and (myRsi[3]<30 and myRsi[4]>=30)


barcolor(shortEmaVal>longEmaVal?color.green:color.red)
//longCondition = crossover(sma(close, 14), sma(close, 28))
barcolor(longCondition?color.yellow:na)
strategy.entry("RSI_V_LE", strategy.long, when=longCondition )
//stoploss value at 10%
stopLossValue=strategy.position_avg_price -  (strategy.position_avg_price*stopLoss/100)
//stopLossValue=valuewhen(longCondition,low,3)


//takeprofit at RSI highest  reading
//at RSI75 move the stopLoss to entry price
moveStopLossUp=strategy.position_size>0 and crossunder(myRsi,70)
barcolor(moveStopLossUp?color.blue:na)
stopLossValue:=crossover(myRsi,70) ? strategy.position_avg_price:stopLossValue

//stopLossValue:=moveStopLossUp?strategy.position_avg_price:stopLossValue
rsiPlotColor=longCondition ?color.yellow:color.purple
rsiPlotColor:= moveStopLossUp ?color.blue:rsiPlotColor
plot(myRsi, title="RSI", linewidth=2, color=rsiPlotColor)
//longCondition?color.yellow:#8D1699)
hline(50, title="Middle Line", linestyle=hline.style_dotted)
obLevel = hline(75, title="Overbought", linestyle=hline.style_dotted)
osLevel = hline(25, title="Oversold", linestyle=hline.style_dotted)
fill(obLevel, osLevel, title="Background", color=#9915FF, transp=90)


//when RSI crossing down 70 , close 1/2 position and move stop loss to average entry price
strategy.close("RSI_V_LE",  qty=strategy.position_size*1/2, when=strategy.position_size>0 and crossunder(myRsi,70))

//when RSI reaches high reading 90 and crossing down close 3/4 position
strategy.close("RSI_V_LE",  qty=strategy.position_size*3/4, when=strategy.position_size>0 and crossunder(myRsi,90))


//close everything when Rsi goes down below to 10 or stoploss hit
//just keeping RSI cross below 10 , can work as stop loss , which also keeps you long in the trade ... however sharp declines could  make large loss
//so I combine RSI goes below 10 OR stoploss hit  , whichever comes first - whole posiition closed
longCloseCondition=crossunder(myRsi,10)  or close<stopLossValue
strategy.close("RSI_V_LE", qty=strategy.position_size,when=longCloseCondition )