Overview
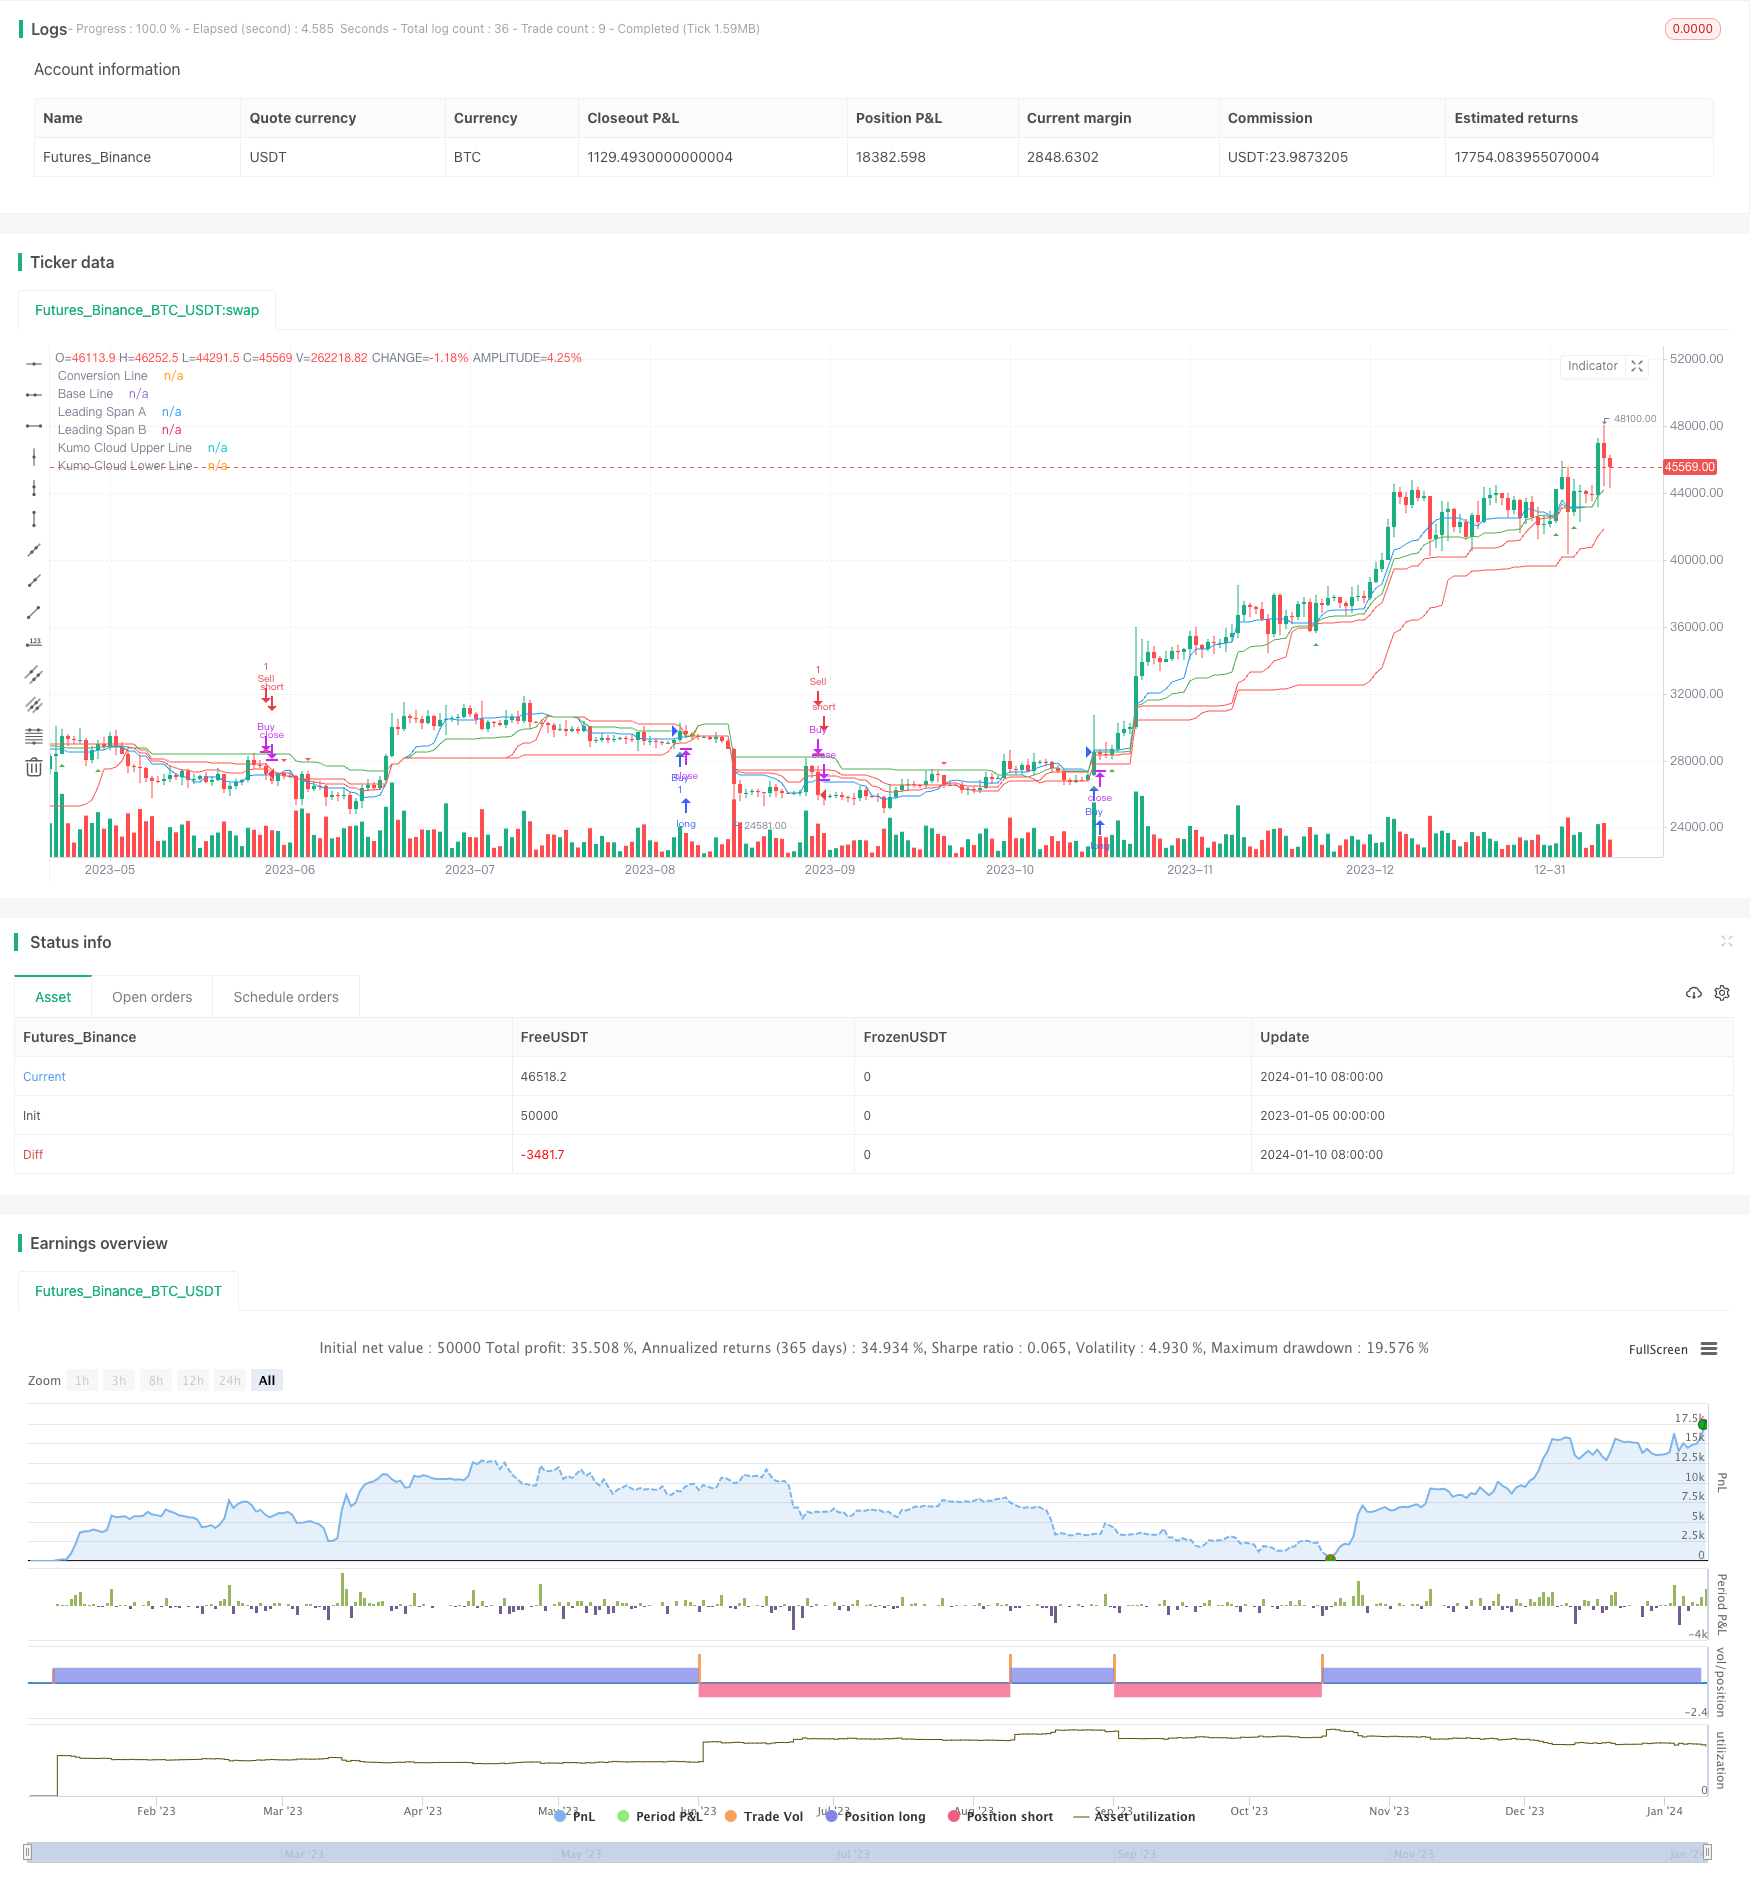
This strategy designs a quantitative trading system based on the Ichimoku Cloud indicator, mainly for assets with good trends. The strategy integrates functions such as stop loss, take profit, and trailing stop loss to achieve stable profits.
Strategy Principle
The Ichimoku Cloud consists of conversion line, base line, leading span 1, leading span 2 and cloud charts. The trading signals of this strategy come from the relationship between price and cloud charts. Specifically, a buy signal is generated when the price crosses above the leading span 1; A sell signal is generated when the price crosses below the leading span 1. In addition, the leading span 2 also serves as an auxiliary judgment indicator.
This strategy also sets stop loss and take profit based on the ATR indicator. The ATR indicator can effectively capture the degree of market fluctuation. The stop loss is set to 2 times the ATR, and the take profit is set to 4 times the ATR. This can effectively control single loss and lock in some profits.
Finally, the strategy adopts a trailing stop loss mechanism. Specifically, for long positions, it will use 2 times the ATR as the callback amplitude to adjust the stop loss line in real time to lock in profits; for short positions, it will use 2 times the ATR as the callback amplitude to adjust the stop loss line in real time to lock in profits.
Advantage Analysis
- Based on the Ichimoku cloud chart indicator, it can effectively capture trends
- With ATR-based stop loss and take profit, it can control risks
- Adopt trailing stop loss mechanism to lock in profits well
- The strategy logic is simple and clear, easy to understand and verify
- parametrization is available, parameters can be adjusted according to different markets
Risk Analysis
- Ichimoku cloud maps are very sensitive to parameter settings, improper settings may miss trading opportunities or generate wrong signals
- If the trailing stop loss amplitude is set too large, stop loss may occur prematurely
- Strong stocks may break through the stop loss line or trailing stop loss line given by the ATR indicator
- Transaction costs will also have some impact on profitability
Solutions to corresponding risks: 1. Optimize the parameters of Ichimoku cloud maps to find the most appropriate settings 2. Evaluate reasonable trailing stop loss amplitude, neither too large nor too small 3. For strong stocks, appropriately relax the stop loss range 4. Choose brokers with low commissions
Optimization Directions
- Combine other technical indicators for signal filtering to reduce wrong trades
- Optimize parameters based on historical data/backtesting
- Parameters for different varieties can be optimized separately
- Consider dynamically adjusting the stop loss amplitude
- Combine algorithms to do feature engineering to build more reliable trading signals
Summary
In general, this strategy is a stable trend tracking strategy. Judge the trend direction based on the Ichimoku cloud indicator; set stop loss and take profit using the ATR indicator; use trailing stop loss to lock in profits. The advantages are simple logic, easy to understand; single loss can be controlled; trend can be tracked effectively. But there are also some risks of parameter sensitivity and stop loss being broken through. By continuously optimizing parameters and the strategy itself, better performance can be obtained.
/*backtest
start: 2023-01-05 00:00:00
end: 2024-01-11 00:00:00
period: 1d
basePeriod: 1h
exchanges: [{"eid":"Futures_Binance","currency":"BTC_USDT"}]
*/

//@version=5
strategy("Ichimoku Cloud Strategy with SL, TP, and Trailing Stop", overlay=true)

conversionPeriods = input(9, "Conversion Line Length")
basePeriods = input(26, "Base Line Length")
laggingSpan2Periods = input(52, "Leading Span B Length")
displacement = input(26, "Lagging Span")
atrLength = input(14, title="ATR Length")

donchian(len) => math.avg(ta.lowest(len), ta.highest(len))
conversionLine = donchian(conversionPeriods)
baseLine = donchian(basePeriods)
leadLine1 = math.avg(conversionLine, baseLine)
leadLine2 = donchian(laggingSpan2Periods)

// Plot the Ichimoku Cloud components
plot(conversionLine, color=color.blue, title="Conversion Line")
plot(baseLine, color=color.red, title="Base Line")
plot(leadLine1, color=color.green, title="Leading Span A")
plot(leadLine2, color=color.orange, title="Leading Span B")
plot(leadLine1 > leadLine2 ? leadLine1 : leadLine2, color=color.green, title="Kumo Cloud Upper Line")
plot(leadLine1 < leadLine2 ? leadLine1 : leadLine2, color=color.red, title="Kumo Cloud Lower Line")

// ATR for stop loss and take profit
atrValue = ta.atr(atrLength)
stopLoss = atrValue * 2
takeProfit = atrValue * 4

// Strategy entry and exit conditions
longCondition = ta.crossover(close, leadLine1) and close > leadLine2
shortCondition = ta.crossunder(close, leadLine1) and close < leadLine2

// Plot buy and sell signals
plotshape(series=longCondition ? leadLine1 : na, title="Buy Signal", location=location.belowbar, color=color.green, style=shape.triangleup, size=size.small)
plotshape(series=shortCondition ? leadLine1 : na, title="Sell Signal", location=location.abovebar, color=color.red, style=shape.triangledown, size=size.small)

// Execute strategy orders with stop loss and take profit
strategy.entry("Buy", strategy.long, when=longCondition)
strategy.close("Buy", when=shortCondition) // Close buy position when sell condition is met
strategy.entry("Sell", strategy.short, when=shortCondition)
strategy.close("Sell", when=longCondition) // Close sell position when buy condition is met

// Trailing stop
strategy.cancel("Trailing Stop")
var float trailingStopPrice = na
if (longCondition)
    trailingStopPrice := math.max(trailingStopPrice, close - atrValue * 2)
    strategy.exit("Trailing Stop", from_entry="Buy", trail_offset=atrValue * 2, trail_price=trailingStopPrice)
else if (shortCondition)
    trailingStopPrice := math.min(trailingStopPrice, close + atrValue * 2)
    strategy.exit("Trailing Stop", from_entry="Sell", trail_offset=atrValue * 2, trail_price=trailingStopPrice)