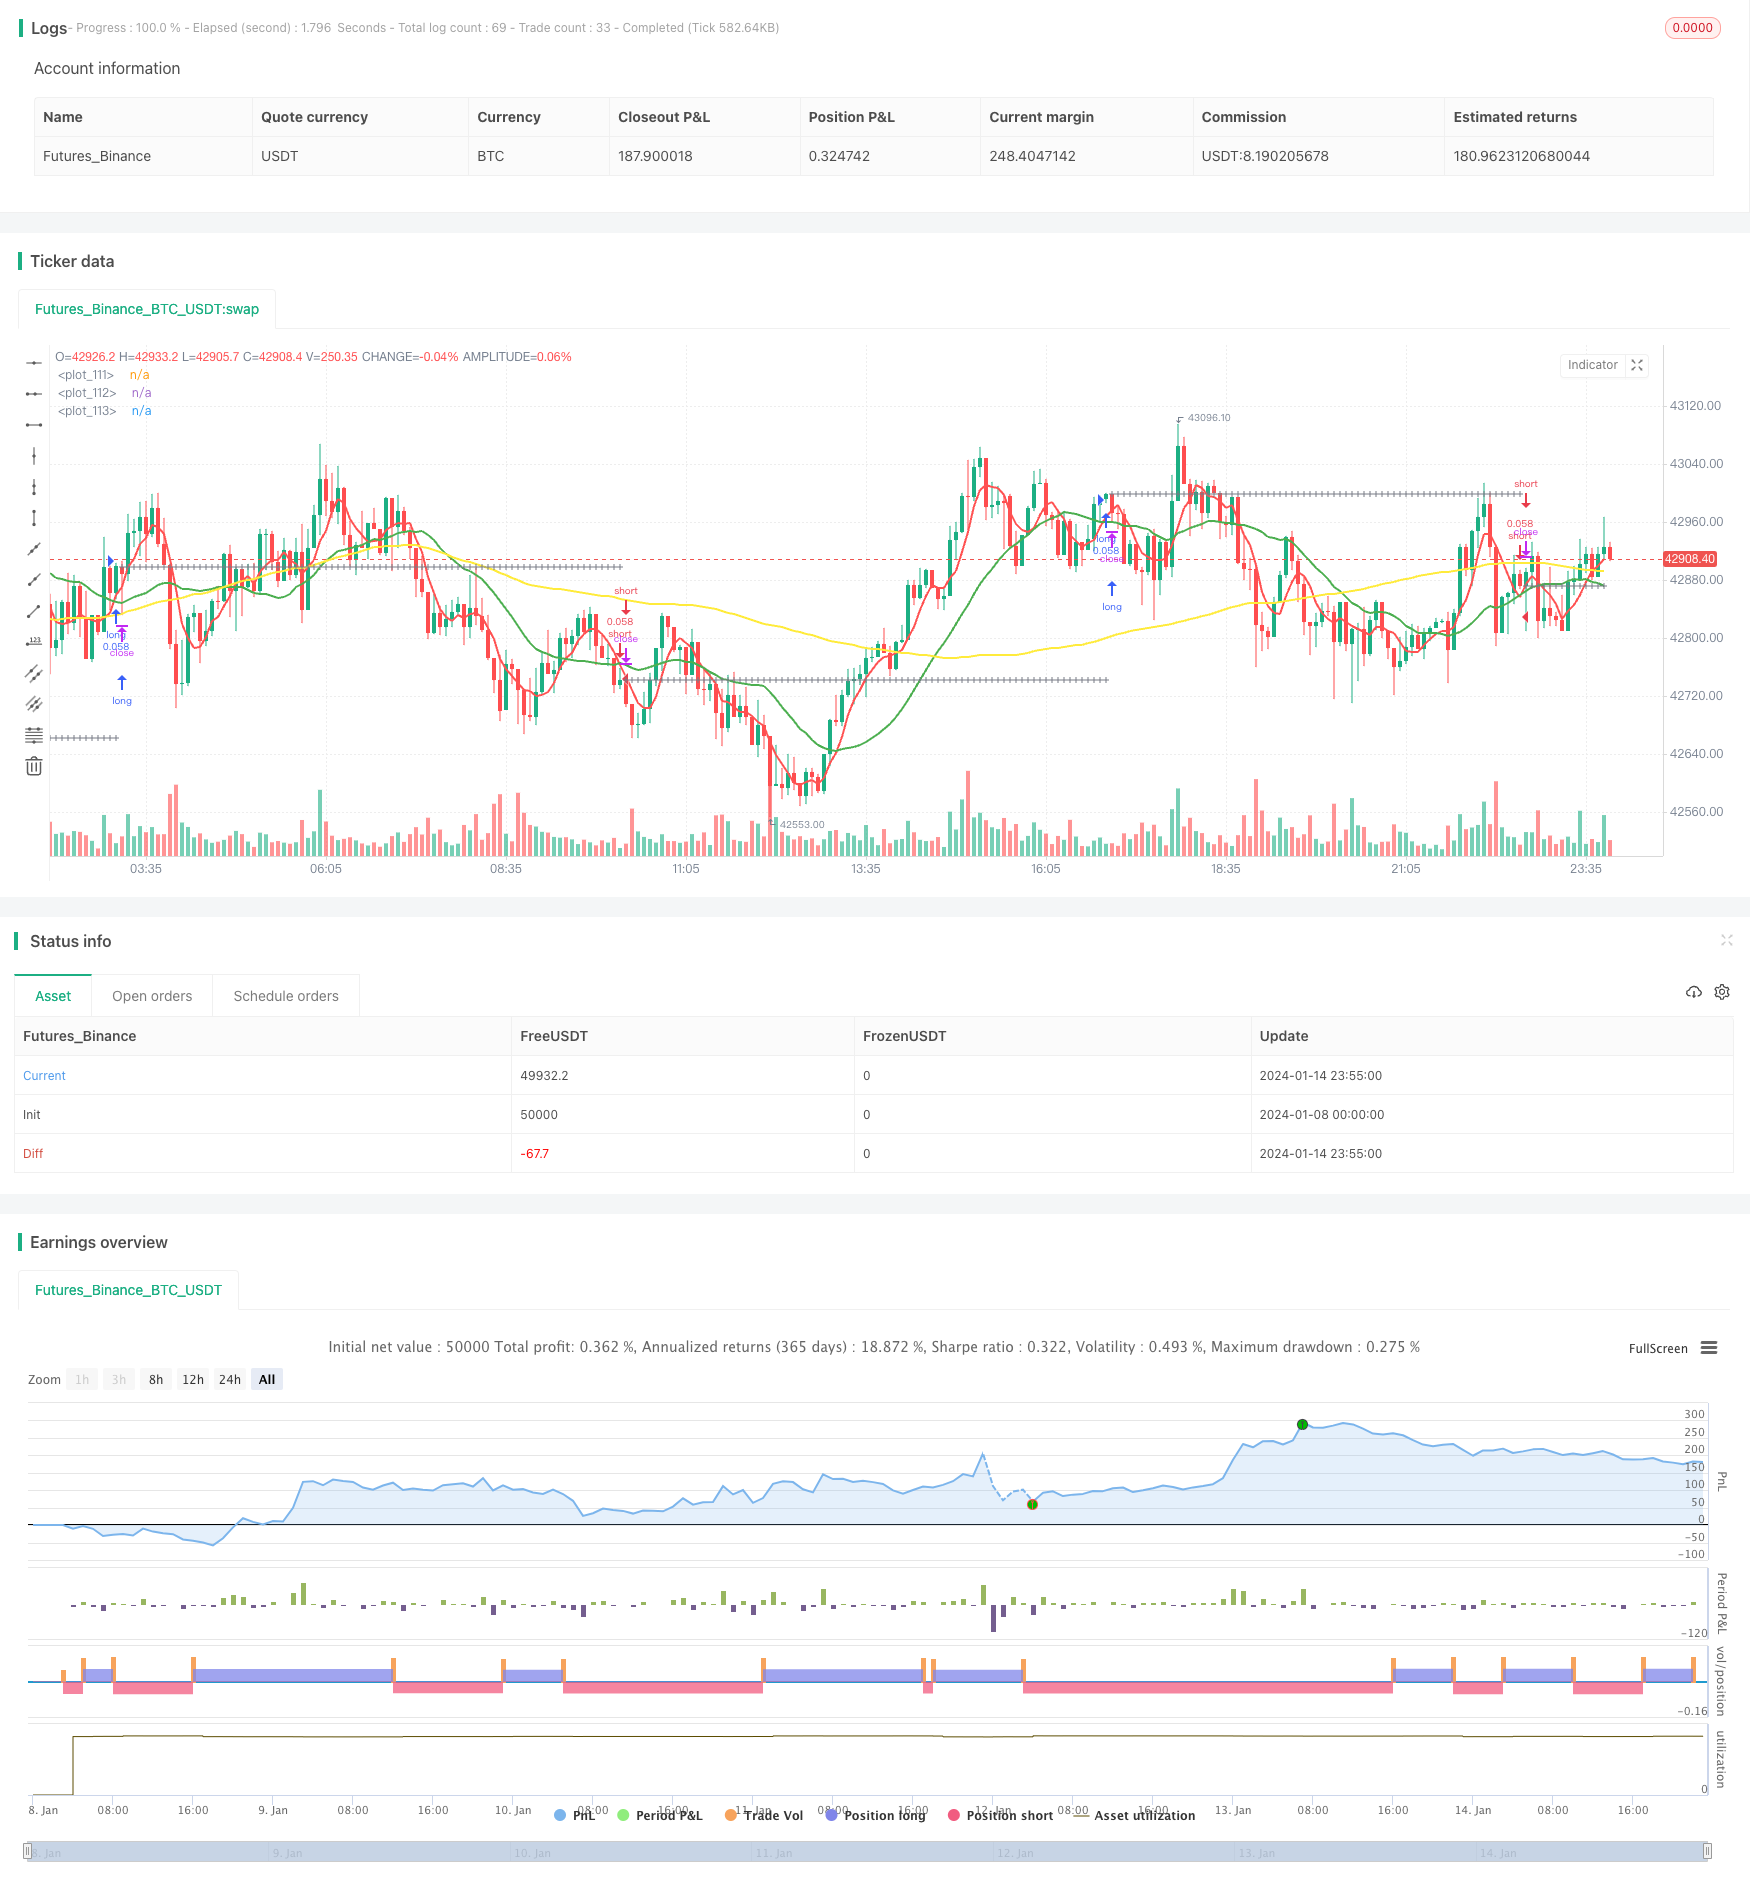
Overview
The Triangular Moving Average (TMA) Crossover trading strategy is a typical technical analysis strategy. It utilizes three moving average lines of different time lengths to capture trends and implement low-risk trading. When the short-term moving average crosses over the medium-term moving average upwards, and the medium-term moving average is above the long-term moving average, a buy signal is generated. When the short-term moving average crosses below the medium-term moving average downwards, and the medium-term moving average is below the long-term moving average, a sell signal is generated.
Strategy Logic
The TMA strategy mainly relies on three moving average lines to determine the trend direction. The short-term moving average responds sensitively to price changes; the medium-term moving average provides a clearer judgment of the trend; the long-term moving average filters out market noise and determines the long-term trend direction.
When the short-term moving average crosses over the medium-term moving average upwards, it indicates the price has started to break out upwards. At this time, if the medium-term moving average is above the long-term moving average, it means the current market is in an uptrend. Therefore, a buy signal is generated here.
On the contrary, when the short-term moving average crosses below the medium-term moving average downwards, it indicates the price has started to break out downwards. At this time, if the medium-term moving average is below the long-term moving average, it means the current market is in a downtrend. As a result, a sell signal is generated.
This strategy also sets stop-loss and take-profit lines. After entering a trade, stop-loss and take-profit prices will be calculated based on the percentage settings. If the price touches either line, the position will be closed.
Advantage Analysis
- Utilize three moving averages together to improve judgment accuracy
- Set stop-loss and take-profit to effectively control per trade risk
- Customizable moving average parameters suitable for different products
- Seven options for moving average types, diversified strategy types
Risk Analysis and Solutions
Wrong signals when three MAs are consolidating
Solution: Adjust MA parameters properly to avoid wrong signals
Over-aggressive stop-loss/take-profit percentage
Solution: Fine-tune percentages; cannot be too big or too small
Improper parameter settings leading to too many or too few trades
Solution: Test different parameter combinations to find optimum
Optimization Directions
The TMA strategy can be optimized from the following aspects:
Test different type and length combinations to find optimum
Test different MA length or type combinations for best results
Add other technical indicators as signal filters
Add indicators like KDJ, MACD etc. for multi-factor verification
Select parameters based on product characteristics
Shorten MA periods for volatile products; Lengthen periods for steady products
Utilize machine learning to find optimum parameters
Auto parameter sweeping to quickly locate optimum
Conclusion
The TMA Crossover strategy is an easy-to-use trend following strategy overall. It utilizes three MAs together to capture trends and sets stop-loss/take-profit to control risks, enabling stable profits. Further improvements can be achieved through parameter optimization and integrating extra technical indicators. In conclusion, this strategy suits investors seeking steady gains.
/*backtest
start: 2024-01-08 00:00:00
end: 2024-01-15 00:00:00
period: 5m
basePeriod: 1m
exchanges: [{"eid":"Futures_Binance","currency":"BTC_USDT"}]
*/

//@version=3
strategy("Kozlod - 3 MA strategy with SL/PT", shorttitle="kozlod_3ma", overlay = true, default_qty_type = strategy.percent_of_equity, default_qty_value = 5)

//
// author: Kozlod
// date: 2018-03-25
//

////////////
// INPUTS //
////////////

ma_type        = input(title = "MA Type",            defval = "SMA", options = ['SMA', 'EMA', 'WMA', 'VWMA', 'HMA', 'SMMA', 'DEMA'])
short_ma_len   = input(title = "Short MA Length",    defval = 5,     minval = 1)
short_ma_src   = input(title = "Short MA Source",    defval = close)
medium_ma_len  = input(title = "Medium MA Length",   defval = 20,    minval = 2)
medium_ma_src  = input(title = "Medium MA Source",   defval = close)
long_ma_len    = input(title = "Long MA Length",     defval = 100,   minval = 3)
long_ma_src    = input(title = "Long MA Source",     defval = close)

sl_lev_perc    = input(title = "SL Level % (0 - Off)", type = float,   defval = 0,  minval = 0, step = 0.01)
pt_lev_perc    = input(title = "PT Level % (0 - Off)", type = float,   defval = 0,  minval = 0, step = 0.01)

// Set initial values to 0
short_ma  = 0.0
long_ma   = 0.0
medium_ma = 0.0

// Simple Moving Average (SMA)
if ma_type == 'SMA'
    short_ma  := sma(short_ma_src,  short_ma_len)
    medium_ma := sma(medium_ma_src, medium_ma_len)
    long_ma   := sma(long_ma_src,   long_ma_len)

// Exponential Moving Average (EMA)
if ma_type == 'EMA'
    short_ma  := ema(short_ma_src,  short_ma_len)
    medium_ma := ema(medium_ma_src, medium_ma_len)
    long_ma   := ema(long_ma_src,   long_ma_len)

// Weighted Moving Average (WMA)
if ma_type == 'WMA'
    short_ma  := wma(short_ma_src,  short_ma_len)
    medium_ma := wma(medium_ma_src, medium_ma_len)
    long_ma   := wma(long_ma_src,   long_ma_len)

// Hull Moving Average (HMA)
if ma_type == 'HMA'
    short_ma  := wma(2*wma(short_ma_src,  short_ma_len  / 2) - wma(short_ma_src,  short_ma_len),  round(sqrt(short_ma_len)))
    medium_ma := wma(2*wma(medium_ma_src, medium_ma_len / 2) - wma(medium_ma_src, medium_ma_len), round(sqrt(medium_ma_len)))
    long_ma   := wma(2*wma(long_ma_src,   long_ma_len   / 2) - wma(long_ma_src,   long_ma_len),   round(sqrt(long_ma_len)))

// Volume-weighted Moving Average (VWMA)
if ma_type == 'VWMA'
    short_ma  := vwma(short_ma_src,  short_ma_len)
    medium_ma := vwma(medium_ma_src, medium_ma_len)
    long_ma   := vwma(long_ma_src,   long_ma_len)

// Smoothed Moving Average (SMMA)
if ma_type == 'SMMA'
    short_ma  := na(short_ma[1])  ? sma(short_ma_src, short_ma_len)   : (short_ma[1]  * (short_ma_len  - 1) + short_ma_src)  / short_ma_len
    medium_ma := na(medium_ma[1]) ? sma(medium_ma_src, medium_ma_len) : (medium_ma[1] * (medium_ma_len - 1) + medium_ma_src) / medium_ma_len
    long_ma   := na(long_ma[1])   ? sma(long_ma_src,  long_ma_len)    : (long_ma[1]   * (long_ma_len   - 1) + long_ma_src)   / long_ma_len

// Double Exponential Moving Average (DEMA)
if ma_type == 'DEMA'
    e1_short  = ema(short_ma_src , short_ma_len)
    e1_medium = ema(medium_ma_src, medium_ma_len)
    e1_long   = ema(long_ma_src,   long_ma_len)

    short_ma  := 2 * e1_short  - ema(e1_short,  short_ma_len)
    medium_ma := 2 * e1_medium - ema(e1_medium, medium_ma_len)
    long_ma   := 2 * e1_long   - ema(e1_long,   long_ma_len)

/////////////
// SIGNALS //
/////////////

long_signal  = crossover( short_ma, medium_ma) and medium_ma > long_ma
short_signal = crossunder(short_ma, medium_ma) and medium_ma < long_ma

// Calculate PT/SL levels
// Initial values
last_signal    = 0
prev_tr_price  = 0.0
pt_level       = 0.0
sl_level       = 0.0

// Calculate previous trade price
prev_tr_price := (long_signal[1] and nz(last_signal[2]) != 1) or (short_signal[1] and nz(last_signal[2]) != -1) ? open : nz(last_signal[1]) != 0 ? prev_tr_price[1] : na

// Calculate SL/PT levels
pt_level := nz(last_signal[1]) == 1 ? prev_tr_price * (1 + pt_lev_perc / 100) : nz(last_signal[1]) == -1 ? prev_tr_price * (1 - pt_lev_perc / 100)  : na
sl_level := nz(last_signal[1]) == 1 ? prev_tr_price * (1 - sl_lev_perc / 100) : nz(last_signal[1]) == -1 ? prev_tr_price * (1 + sl_lev_perc / 100)  : na

// Calculate if price hit sl/pt
long_hit_pt = pt_lev_perc > 0 and nz(last_signal[1]) ==  1 and close >= pt_level
long_hit_sl = sl_lev_perc > 0 and nz(last_signal[1]) ==  1 and close <= sl_level

short_hit_pt = pt_lev_perc > 0 and nz(last_signal[1]) ==  -1 and close <= pt_level
short_hit_sl = sl_lev_perc > 0 and nz(last_signal[1]) ==  -1 and close >= sl_level

// What is last active trade?
last_signal := long_signal ? 1 : short_signal ? -1 : long_hit_pt or long_hit_sl or short_hit_pt or short_hit_sl ? 0 : nz(last_signal[1])

//////////////
// PLOTTING //
//////////////

// Plot MAs
plot(short_ma,  color = red,    linewidth = 2)
plot(medium_ma, color = green,  linewidth = 2)
plot(long_ma,   color = yellow, linewidth = 2)


// Plot Levels
plotshape(prev_tr_price, style = shape.cross, color = gray, location  = location.absolute, size = size.small)


plotshape(sl_lev_perc > 0 ? sl_level : na, style = shape.cross, color = red,   location  = location.absolute, size = size.small)
plotshape(pt_lev_perc > 0 ? pt_level : na, style = shape.cross, color = green, location  = location.absolute, size = size.small)

//////////////
// STRATEGY //
//////////////

strategy.entry("long",  true,  when = long_signal)
strategy.entry("short", false, when = short_signal)

strategy.close("long",  when = long_hit_pt  or long_hit_sl)
strategy.close("short", when = short_hit_pt or short_hit_sl)