Overview
This strategy draws two lines based on the highest and lowest prices of daily candlesticks for judgments of long/short trends. It goes long when price breaks through the highest price line and goes short when price breaks through the lowest price line. It can automatically switch between long and short positions.
Strategy Logic
This strategy mainly utilizes the pivot points of daily candlesticks to determine long/short trends. The so-called “pivot points” refer to yesterday’s highest and lowest prices. These two lines form a trading range. If today’s price breaks through either of them, it indicates a reversal of the trend.
Specifically, the main logic is as follows:
- Highest price line: Plot yesterday’s highest price level. A break-through signals long trend.
- Lowest price line: Plot yesterday’s lowest price level. A break-through signals short trend.
- Long entry: Open long position when closing price breaks through highest price line.
- Short entry: Open short position when closing price breaks through lowest price line.
- Stop loss: Long stop loss near lowest price line, short stop loss near highest price line.
By capturing trends through break-throughs of highest/lowest prices, it realizes automatic switching between long and short.
Advantage Analysis
The main advantages of this strategy are:
- Simple logic, easy to understand and implement
- Based on daily bars, long cycle, less susceptible to short-term noises
- Automatic switch between long and short, avoid non-trending markets
- Clear stop loss, beneficial for risk control
Risk Analysis
Some risks:
- Daily bars have lower frequency, unable to stop loss timely
- Fake break-throughs may cause unnecessary losses
- Long holding may lead to expanded losses
Improvements:
- Add other higher frequency indicators for confirmation
- Optimize parameters to filter out fake break-throughs
- Adopt progressive stop loss methods for timely stop loss
Optimization Directions
Some directions:
- More backtesting on different products and longer datasets to test stability
- Explore other break-through indicators like channels, Bollinger Bands etc.
- Incorporate trading volume to avoid false breaks without volume
- Add more filters to reduce false breaks
- Utilize machine learning for parameter optimization
Summary
In summary, this simple strategy realizes auto long/short based on daily pivots. The logic is clear and easy to understand. Further optimizations can improve stability. Investors can apply it to live trading based on personal risk preference.
/*backtest
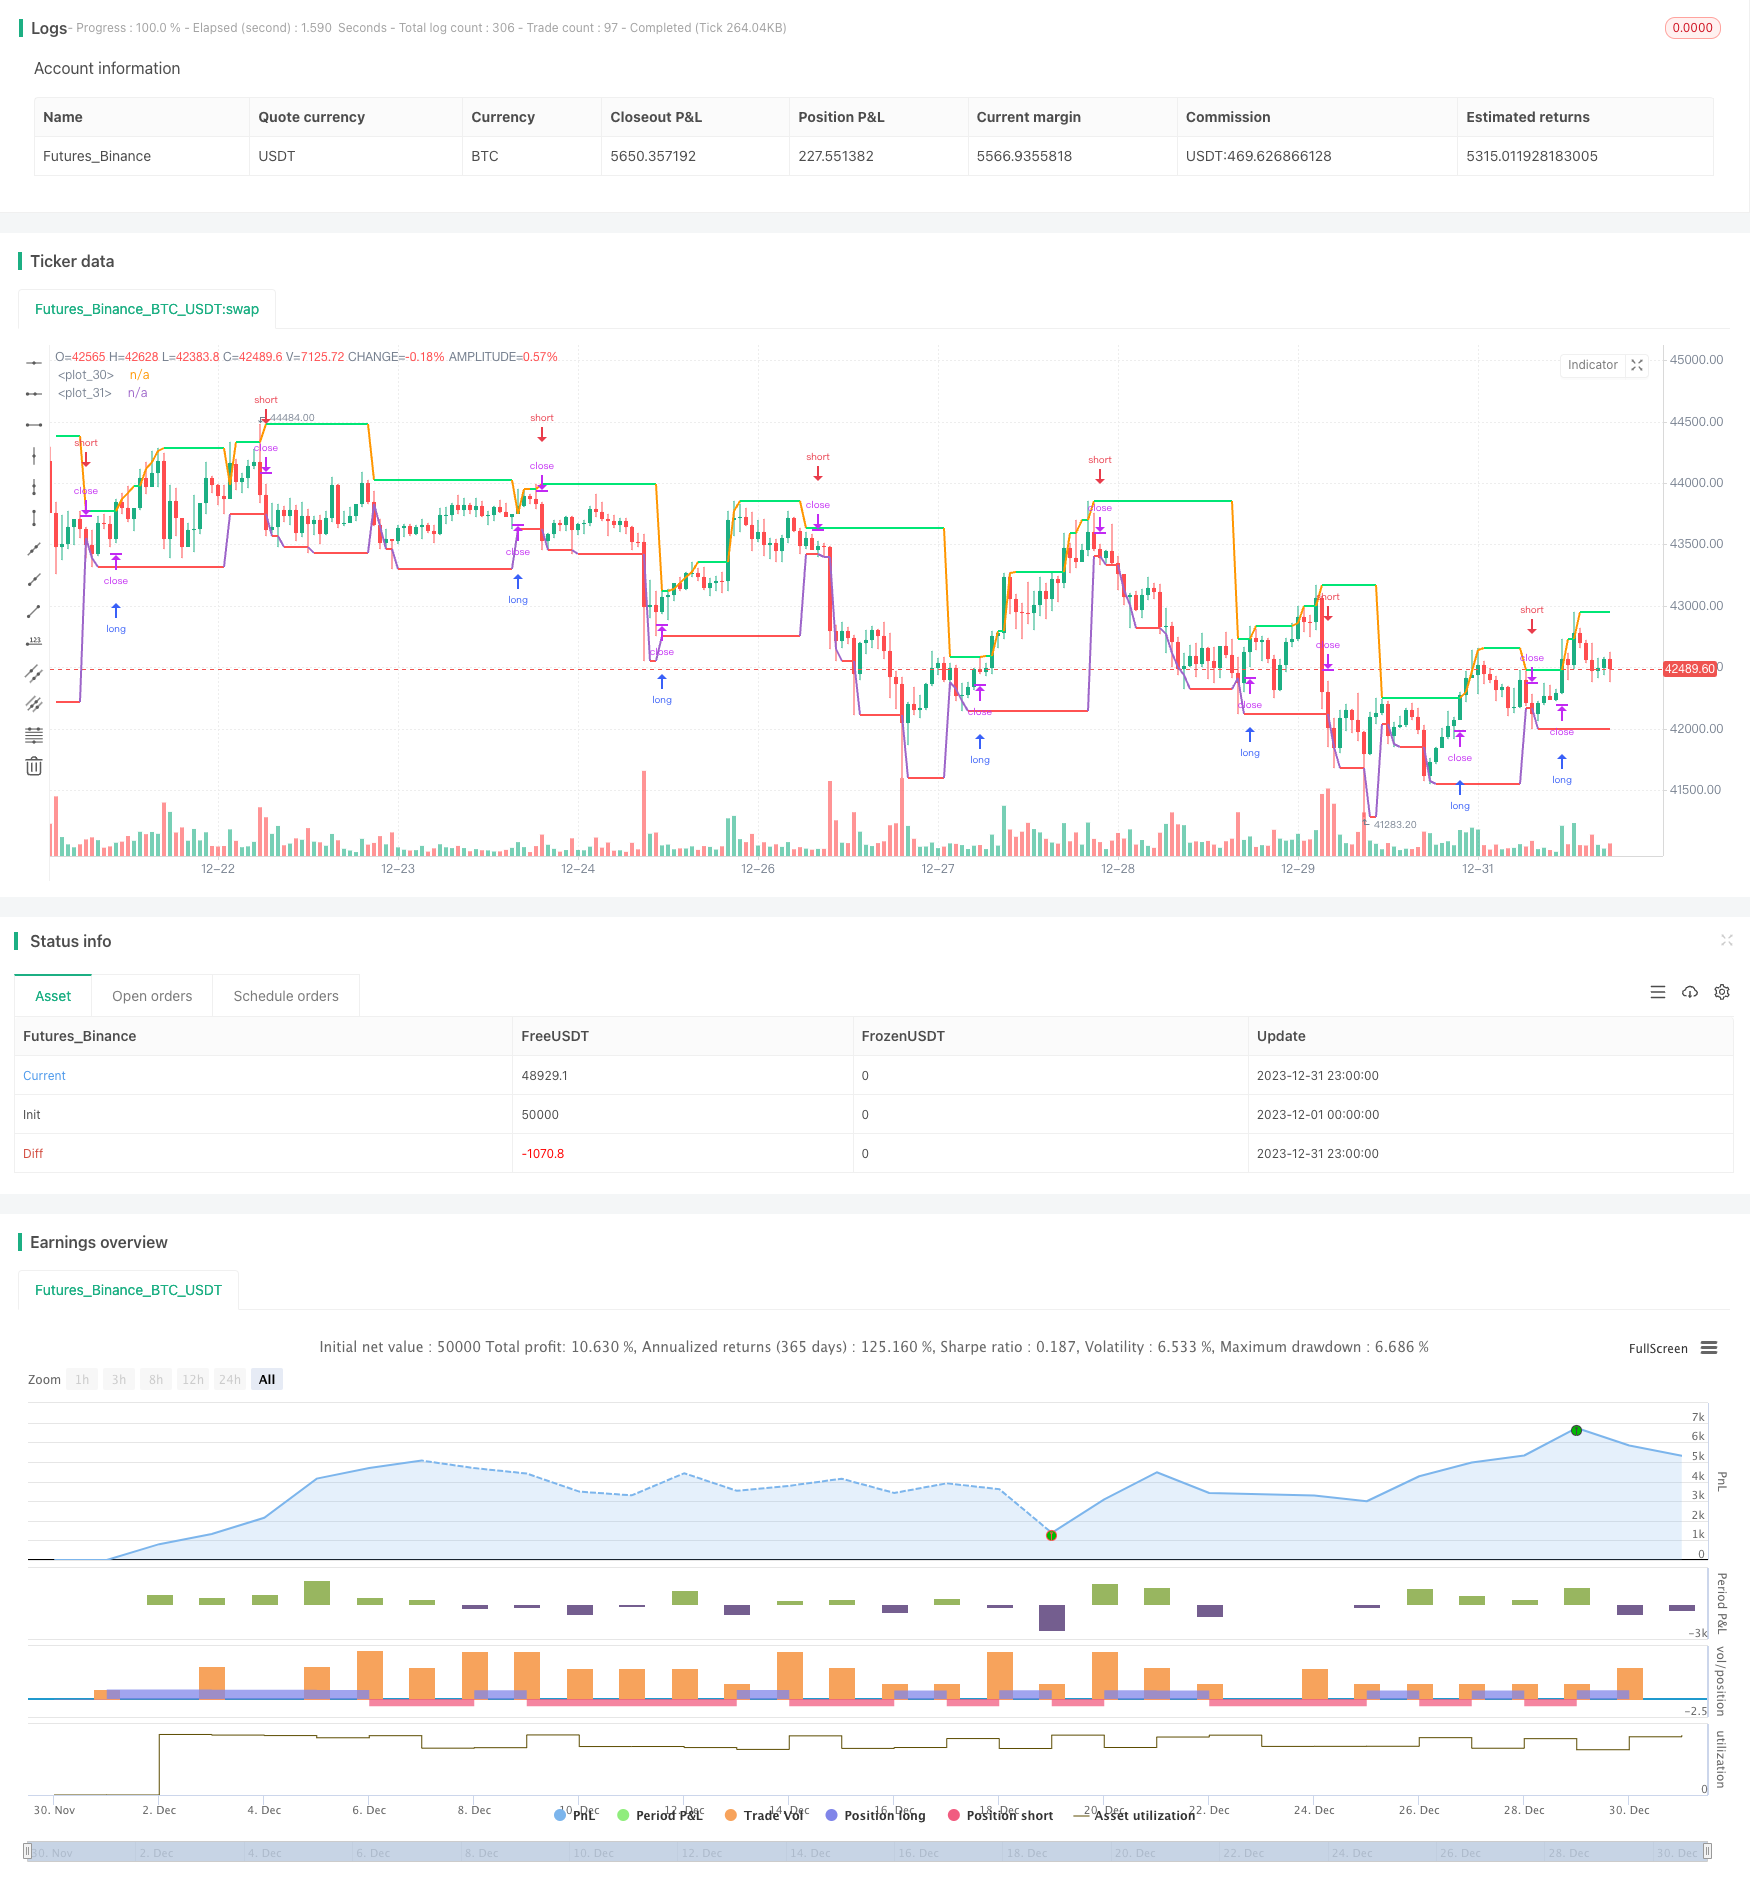
start: 2023-12-01 00:00:00
end: 2023-12-31 23:59:59
period: 1h
basePeriod: 15m
exchanges: [{"eid":"Futures_Binance","currency":"BTC_USDT"}]
*/
//Noro
//2019
//@version=3
strategy(title = "Noro's DEX Strategy", shorttitle = "DEX str", overlay = true, default_qty_type = strategy.percent_of_equity, default_qty_value = 100, pyramiding = 0)
//Settings
needlong = input(true, defval = true, title = "Long")
needshort = input(false, defval = false, title = "Short")
capital = input(100, defval = 100, minval = 1, maxval = 10000, title = "Lot")
showlines = input(true, title = "Show lines")
showbg = input(false, title = "Show background")
showday = input(false, title = "Show new day")
fromyear = input(1900, defval = 1900, minval = 1900, maxval = 2100, title = "From Year")
toyear = input(2100, defval = 2100, minval = 1900, maxval = 2100, title = "To Year")
frommonth = input(01, defval = 01, minval = 01, maxval = 12, title = "From Month")
tomonth = input(12, defval = 12, minval = 01, maxval = 12, title = "To Month")
fromday = input(01, defval = 01, minval = 01, maxval = 31, title = "From day")
today = input(31, defval = 31, minval = 01, maxval = 31, title = "To day")
//New day trand
bar = close > open ? 1 : close < open ? -1 : 0
newday = request.security(syminfo.tickerid, 'D', time)
//Lines
uplevel = request.security(syminfo.tickerid, 'D', high)
dnlevel = request.security(syminfo.tickerid, 'D', low)
upcolor = uplevel == uplevel[1] and showlines ? lime : na
dncolor = dnlevel == dnlevel[1] and showlines? red : na
plot(uplevel, offset = 1, linewidth = 2, color = upcolor)
plot(dnlevel, offset = 1, linewidth = 2, color = dncolor)
//Background
size = strategy.position_size
col = time == newday + 86400000 and showday ? blue : showbg and size > 0 ? lime : showbg and size < 0 ? red : na
bgcolor(col)
//Orders
lot = 0.0
lot := size != size[1] ? strategy.equity / close * capital / 100 : lot[1]
truetime = true
if uplevel > 0 and dnlevel > 0
strategy.entry("Long", strategy.long, needlong ? lot : 0, stop = uplevel, when = truetime)
strategy.entry("Close", strategy.short, needshort ? lot : 0, stop = dnlevel, when = truetime)