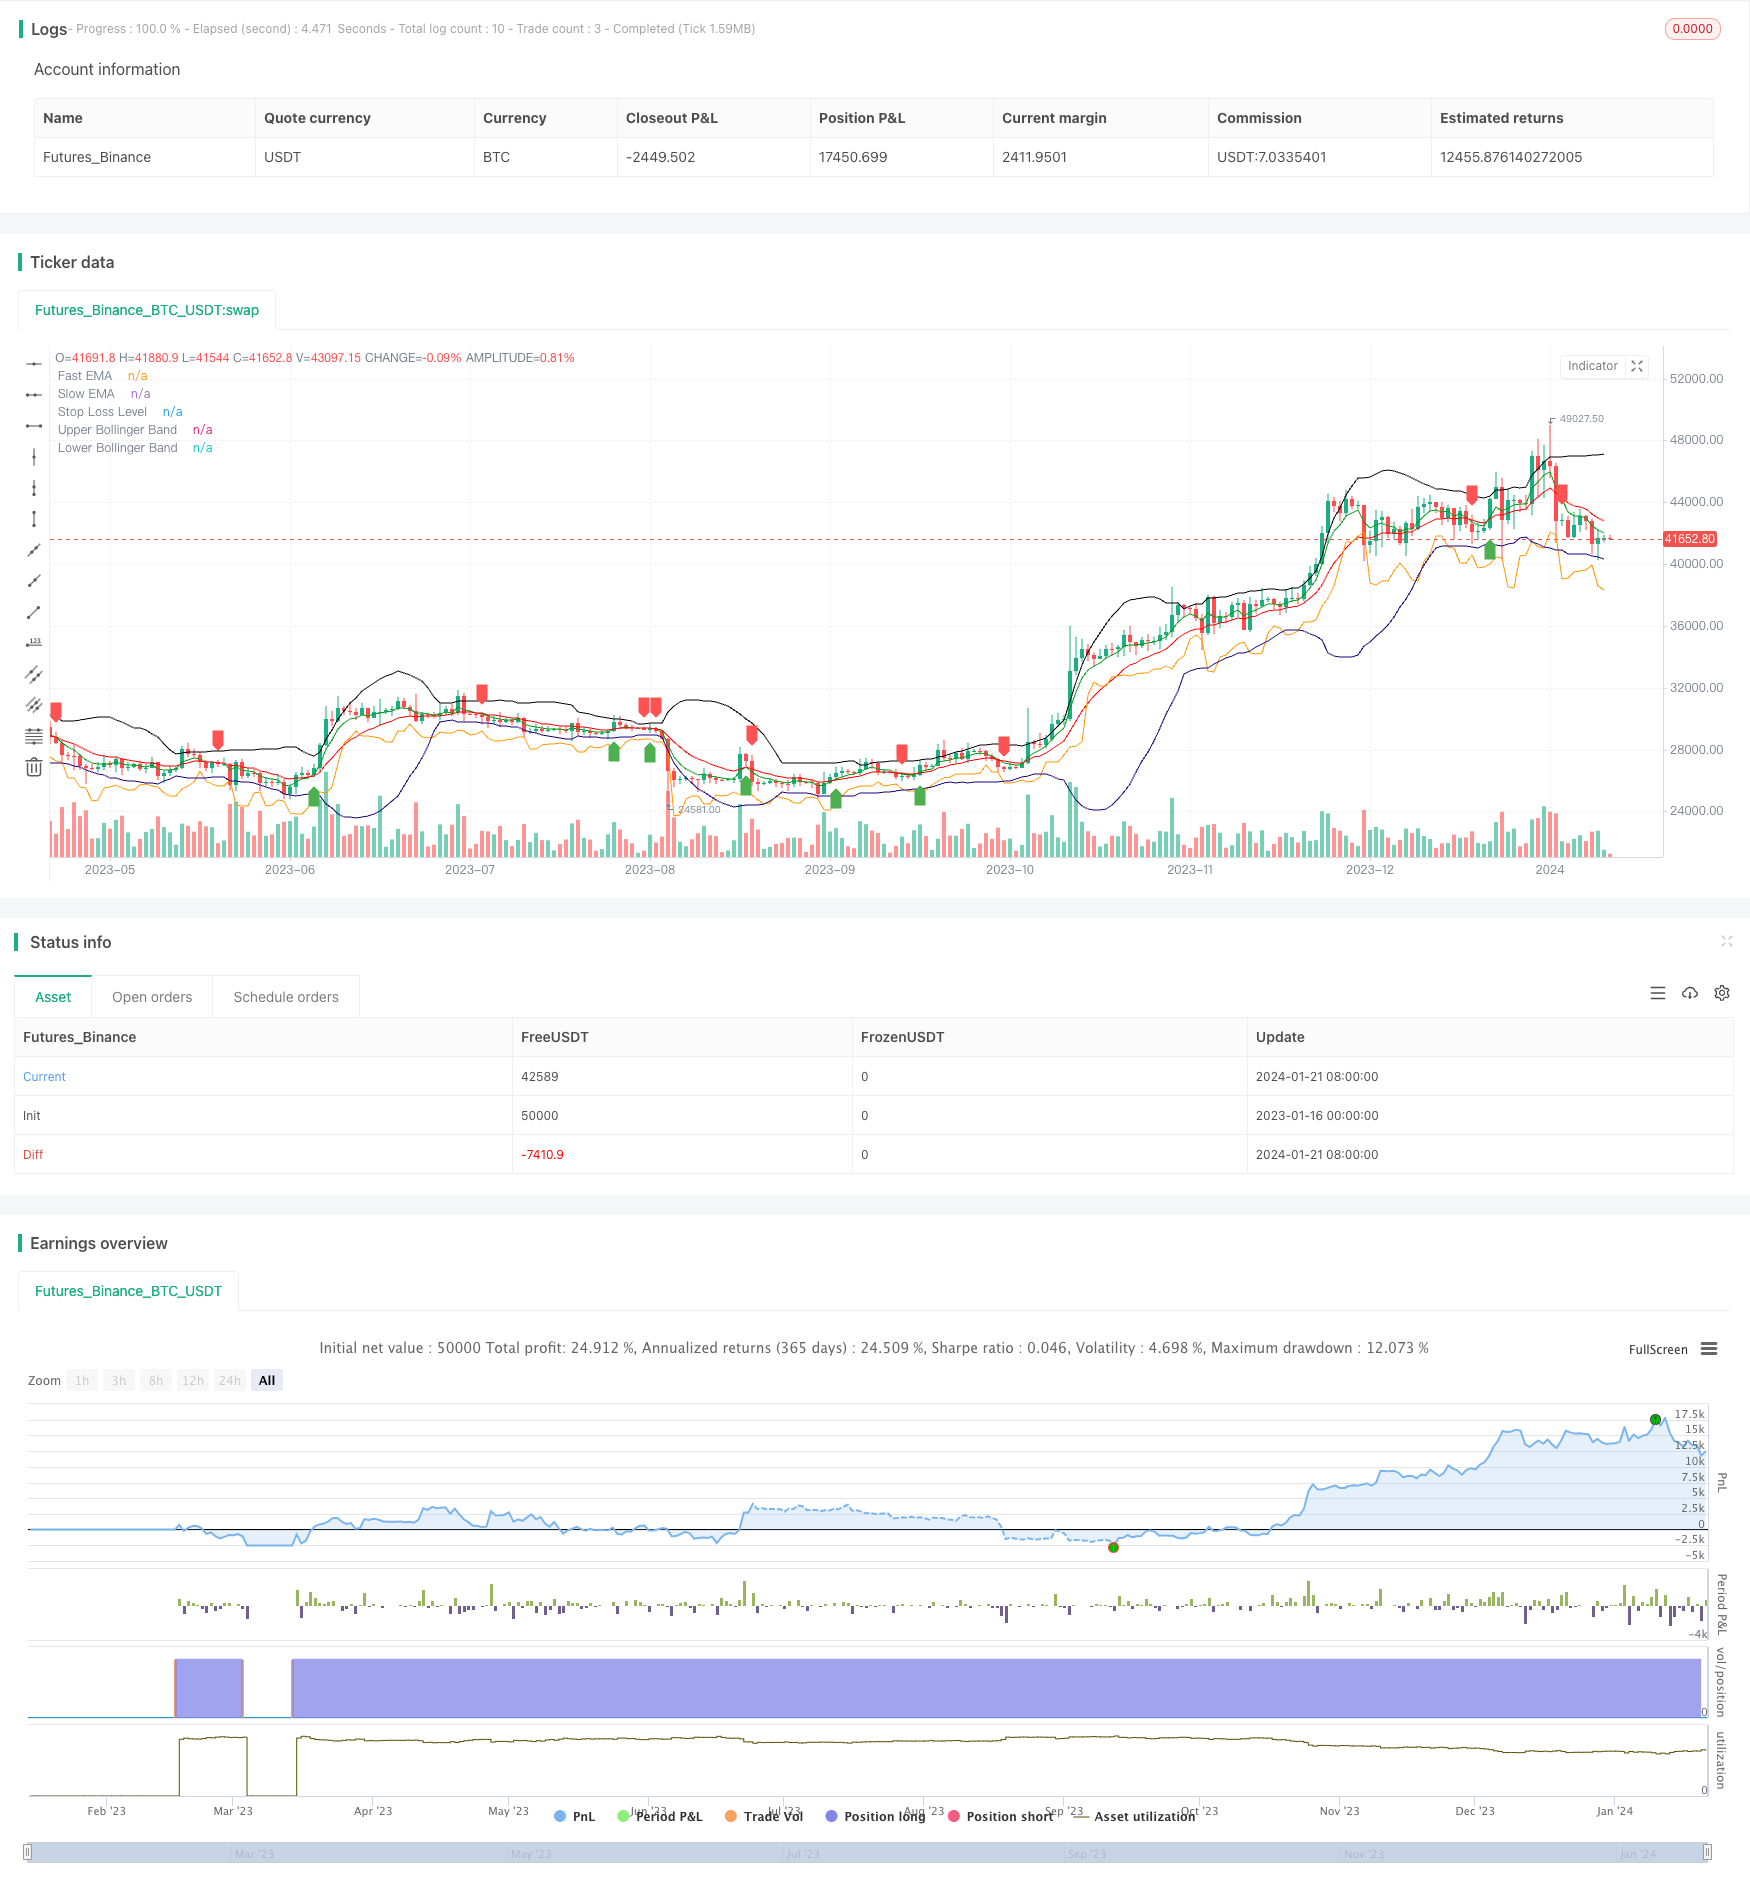
Overview
The Double Gap strategy is a quantitative strategy used for short-term trading of Bitcoin and gold. It combines moving averages, Bollinger Bands and ATR stops to identify breakout signals and manage risk.
Strategy Logic
The Double Gap strategy uses fast EMA and slow EMA crossovers to determine trend direction. A buy signal is generated when the fast EMA crosses above the slow EMA, and a sell signal is generated when the fast EMA crosses below the slow EMA. To avoid false breakouts, the strategy requires the crossover to happen near the upper or middle Bollinger Bands. This is where the name “Double Gap” comes from.
Specifically, to determine a buy signal, both of the following conditions need to be met: 1) The fast EMA crosses above the slow EMA; 2) The close price is near or below the upper or middle Bollinger Bands. Judging the sell signal is similar. It requires the fast EMA to cross below the slow EMA and be near the lower or middle Bollinger Bands.
In addition, the Double Gap strategy uses the ATR indicator to calculate a dynamic stop loss to control the risk of each trade. The specific stop level is the lowest low of the most recent two bars minus N times the ATR.
Advantages
- Identifies high probability breakouts using dual filters
- Fast EMA crossover judges main trend, Bollinger Bands filter false breakouts
- Dynamic ATR stop effectively controls single trade risks
- Suitable for short-term trading of high volatility products like BTC
Risks
- Improper fast and slow EMA parameters may produce excessive false signals
- Inappropriate Bollinger Bands parameters will also greatly reduce filtering effectiveness
- Stop loss set too tight increases probability of it being triggered
- High trading frequency required, not suitable for small accounts
Optimization
The Double Gap strategy can be optimized from the following aspects:
- Optimize moving average parameters to find best fast and slow EMA combinations
- Optimize Bollinger Bands parameters to reduce false breakout rates
- Adjust ATR stop multiplier according to different products and market regimes
- Add re-entry signal after stop out
- Combine with other indicators like RSI, KD etc as confirmation
Conclusion
The Double Gap strategy effectively identifies short-term opportunities using both trend following and breakout filtering. With dynamic stop loss management, it is well suited for short-term trading of high volatility digital currencies and precious metals. Further improvements in stability and profitability can be achieved through parameter and logic optimization.
/*backtest
start: 2023-01-16 00:00:00
end: 2024-01-22 00:00:00
period: 1d
basePeriod: 1h
exchanges: [{"eid":"Futures_Binance","currency":"BTC_USDT"}]
*/

// This source code is subject to the terms of the Mozilla Public License 2.0 at https://mozilla.org/MPL/2.0/
// © singhak8757

//@version=5
strategy("Bitcoin and Gold 5min Scalping Strategy2.0", overlay=true)


// Input parameters
fastLength = input(5, title="Fast EMA Length")
slowLength = input(13, title="Slow EMA Length")
bollingerLength = input(20, title="Bollinger Band Length")
bollingerMultiplier = input(2, title="Bollinger Band Multiplier")
stopLossMultiplier = input(1, title="Stop Loss Multiplier")

// Calculate EMAs
fastEMA = ta.ema(close, fastLength)
slowEMA = ta.ema(close, slowLength)

// Calculate Bollinger Bands
basis = ta.sma(close, bollingerLength)
upperBand = basis + bollingerMultiplier * ta.stdev(close, bollingerLength)
lowerBand = basis - bollingerMultiplier * ta.stdev(close, bollingerLength)

// Buy condition
buyCondition = ta.crossover(fastEMA, slowEMA) and (close <= upperBand or close <= basis)

// Sell condition
sellCondition = ta.crossunder(fastEMA, slowEMA) and (close >= lowerBand or close >= basis)

// Calculate stop loss level
stopLossLevel = ta.lowest(low, 2)[1] - stopLossMultiplier * ta.atr(14)

// Plot EMAs
plot(fastEMA, color=color.rgb(0, 156, 21), title="Fast EMA")
plot(slowEMA, color=color.rgb(255, 0, 0), title="Slow EMA")

// Plot Bollinger Bands
plot(upperBand, color=color.new(#000000, 0), title="Upper Bollinger Band")
plot(lowerBand, color=color.new(#1b007e, 0), title="Lower Bollinger Band")

// Plot Buy and Sell signals
plotshape(series=buyCondition, title="Buy Signal", color=color.green, style=shape.labelup, location=location.belowbar)
plotshape(series=sellCondition, title="Sell Signal", color=color.red, style=shape.labeldown, location=location.abovebar)

// Plot Stop Loss level
plot(stopLossLevel, color=color.orange, title="Stop Loss Level")

// Strategy logic
strategy.entry("Buy", strategy.long, when = buyCondition)
strategy.exit("Stop Loss/Close", from_entry="Buy", loss=stopLossLevel)
strategy.close("Sell", when = sellCondition)