Overview
The Dual Moving Average Breakout Strategy is a quantitative trading strategy based on a fast moving average and a slow moving average. It uses two exponential moving averages (EMA) with different periods as trading signals. When the fast EMA crosses above the slow EMA, a buy signal is generated. When the fast EMA crosses below the slow EMA, a sell signal is generated.
Strategy Logic
The core logic of this strategy is to use a fast moving average and a slow moving average to form trading signals. The strategy defines the fast EMA period as 12 days and the slow EMA period as 26 days. The calculation method is as follows:
- Calculate the exponential moving average AP of the price array with a period of 2 days
- Calculate the fast moving average Fast based on AP, with a period of 12 days
- Calculate the slow moving average Slow based on AP, with a period of 26 days
- Compare the fast and slow moving averages:
- When Fast crosses above Slow, it is a bullish signal
- When Fast crosses below Slow, it is a bearish signal
- Determine specific trading signals combining price and moving average relationship:
- Bullish signal: Fast>Slow && AP>Fast
- Bearish signal: Fast
Using the crossover of the fast and slow moving average to determine market trends and generate trading signals is a typical dual moving average strategy.
Advantage Analysis
The Dual Moving Average Breakout Strategy has the following advantages:
- The strategy logic is simple and clear, easy to understand and implement
- The moving average period can be adjusted to adapt to different market environments
- Allow both long and short positions to achieve higher returns
- More precise trading signals can be generated combining price and moving averages
- The lagging feature of moving averages can effectively filter out market noise
Risk Analysis
The Dual Moving Average Breakout Strategy also has some risks:
- More false signals may occur when the market is range-bound
- The dual moving average strategy may cause curve fitting, ignoring structural market changes
- Relying solely on technical indicators is vulnerable to fake breakouts, with the risk of losses
Solutions:
- Optimize the moving average period to better adapt to current market conditions
- Confirm signals with other indicators like volume to avoid fake breakouts
- Adopt trend following strategies to control profit/loss ratio and reduce risk
Optimization Directions
The Dual Moving Average Breakout Strategy can be optimized in the following aspects:
- Find more suitable moving average period combinations to adapt to market changes
- Add indicators like volume for signal filtering to ensure validity
- Incorporate market structure indicators to identify trends and adjust parameters
- Adopt dynamic moving averages which can automatically adjust periods based on market changes
- Incorporate stop loss strategies to effectively control risk and protect capital
Conclusion
The Dual Moving Average Breakout Strategy is a simple and practical quantitative trading strategy. It has advantages like easy logic and implementation, and also has some market adaptability issues. We can make it a stable profitable trading system through parameter optimization, signal filtering, risk control etc. Overall, the dual moving average strategy is a great strategy prototype worth in-depth research and application for quantitative traders.
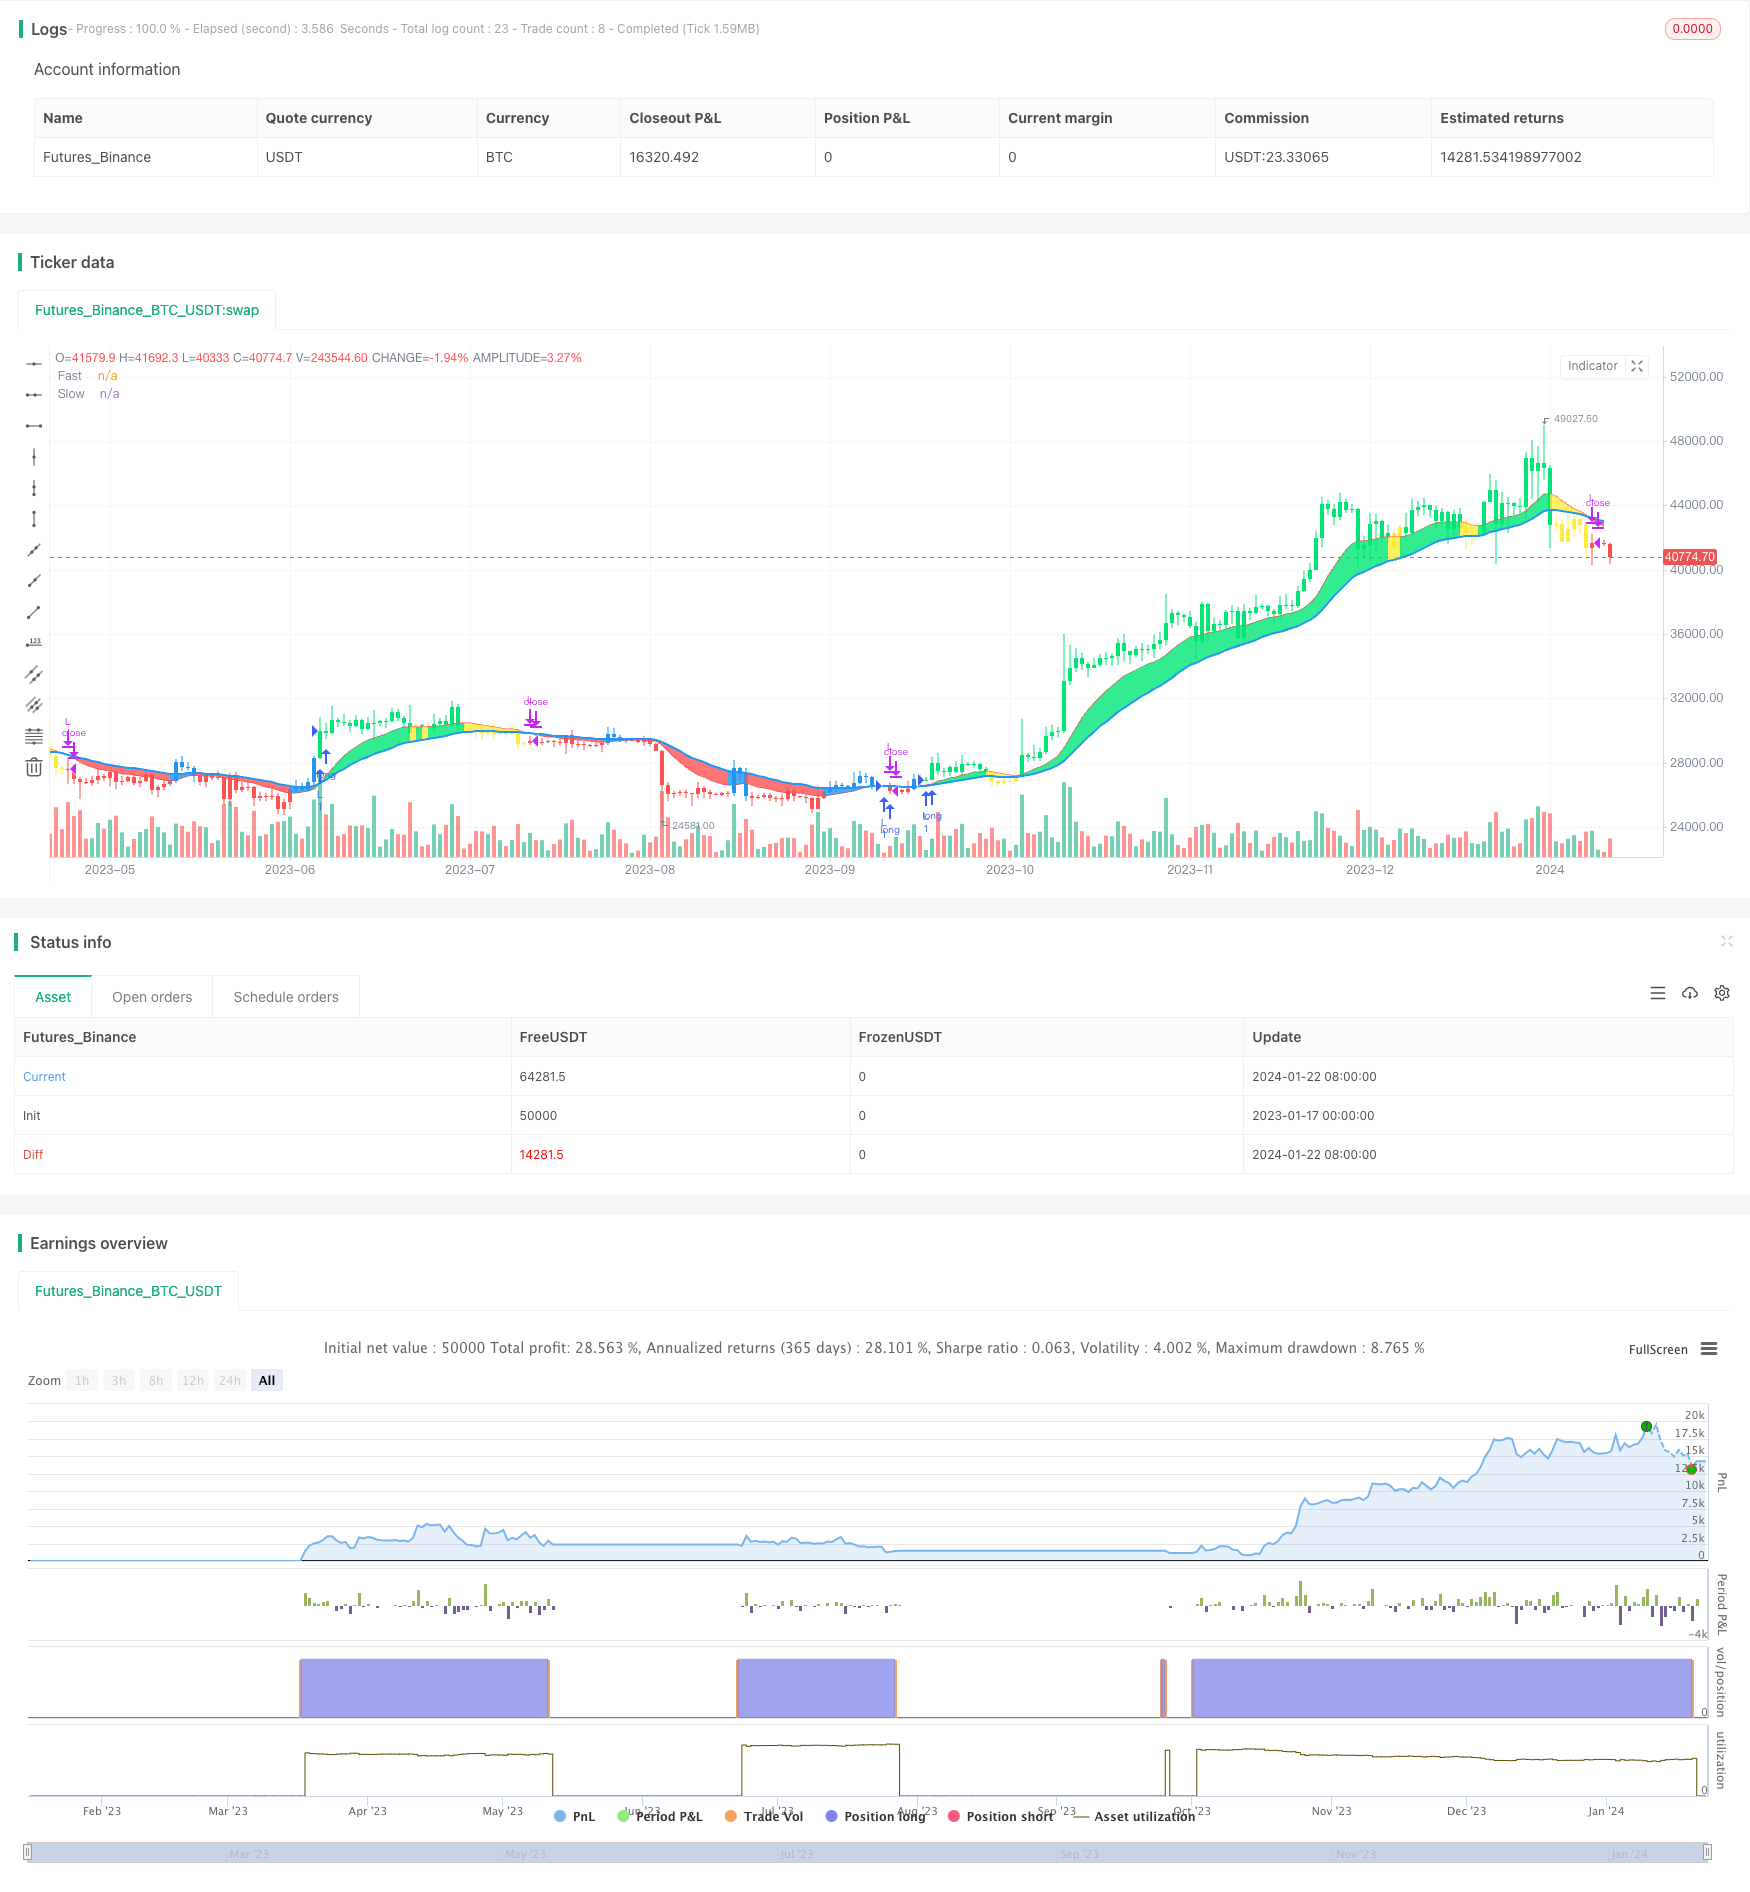
/*backtest
start: 2023-01-17 00:00:00
end: 2024-01-23 00:00:00
period: 1d
basePeriod: 1h
exchanges: [{"eid":"Futures_Binance","currency":"BTC_USDT"}]
*/

//@version=4
strategy("CDC Action Zone V.2", overlay=true)

// CDC ActionZone V2 29 Sep 2016
// CDC ActionZone is based on a simple 2MA and is most suitable for use with medium volatility market
// 11 Nov 2016 : Ported to Trading View with minor UI enhancement
LSB = input(title="Long/Short", defval="Long only", options=["Long only", "Short only" , "Both"])
src = input(title="Data Array",type=input.source,defval=ohlc4)
prd1=input(title="Short MA period", type=input.integer,defval=12)
prd2=input(title="Long MA period",type=input.integer,defval=26)
AP = ema(src,2)
Fast = ema(AP,prd1)
Slow = ema(AP,prd2)


Bullish = Fast>Slow
Bearish = Fast<Slow

Green = Bullish and AP>Fast
Red = Bearish and AP<Fast
Yellow = Bullish and AP<Fast
Blue = Bearish and AP>Fast

Buy = Bullish and Bearish[1]
Sell = Bearish and Bullish[1]


alertcondition(Buy,"Buy Signal","Buy")
alertcondition(Sell,"Sell Signal","Sell")


//Plot

l1=plot(Fast,"Fast", linewidth=1,color=color.red)
l2=plot(Slow,"Slow", linewidth=2,color=color.blue)
bcolor = Green ? color.lime : Red ? color.red : Yellow ? color.yellow : Blue ? color.blue : na
barcolor(color=bcolor)
fill(l1,l2,bcolor)

// === INPUT BACKTEST RANGE ===
FromYear  = input(defval = 2000, title = "From Year", minval = 1920)
FromMonth = input(defval = 1, title = "From Month", minval = 1, maxval = 12)
FromDay   = input(defval = 1, title = "From Day", minval = 1, maxval = 31)
ToYear    = input(defval = 9999, title = "To Year", minval = 1921)
ToMonth   = input(defval = 12, title = "To Month", minval = 1, maxval = 12)
ToDay     = input(defval = 31, title = "To Day", minval = 1, maxval = 31)

// === FUNCTION EXAMPLE ===
start     = timestamp(FromYear, FromMonth, FromDay, 00, 00)  // backtest start window
finish    = timestamp(ToYear, ToMonth, ToDay, 23, 59)        // backtest finish window
window()  => true // create function "within window of time"


if LSB == "Long only" and Buy and window()
    strategy.entry("L",true)
if LSB == "Long only" and Sell and window()
    strategy.close("L",qty_percent=100,comment="TP Long")
if LSB == "Both" and Buy and window()
    strategy.entry("L",true)
if LSB == "Both" and Sell and window()
    strategy.entry("S",false)
if LSB == "Short only" and Sell and window()
    strategy.entry("S",false)
if LSB == "Short only" and Buy and window()
    strategy.close("S",qty_percent=100,comment="TP Short")