Overview
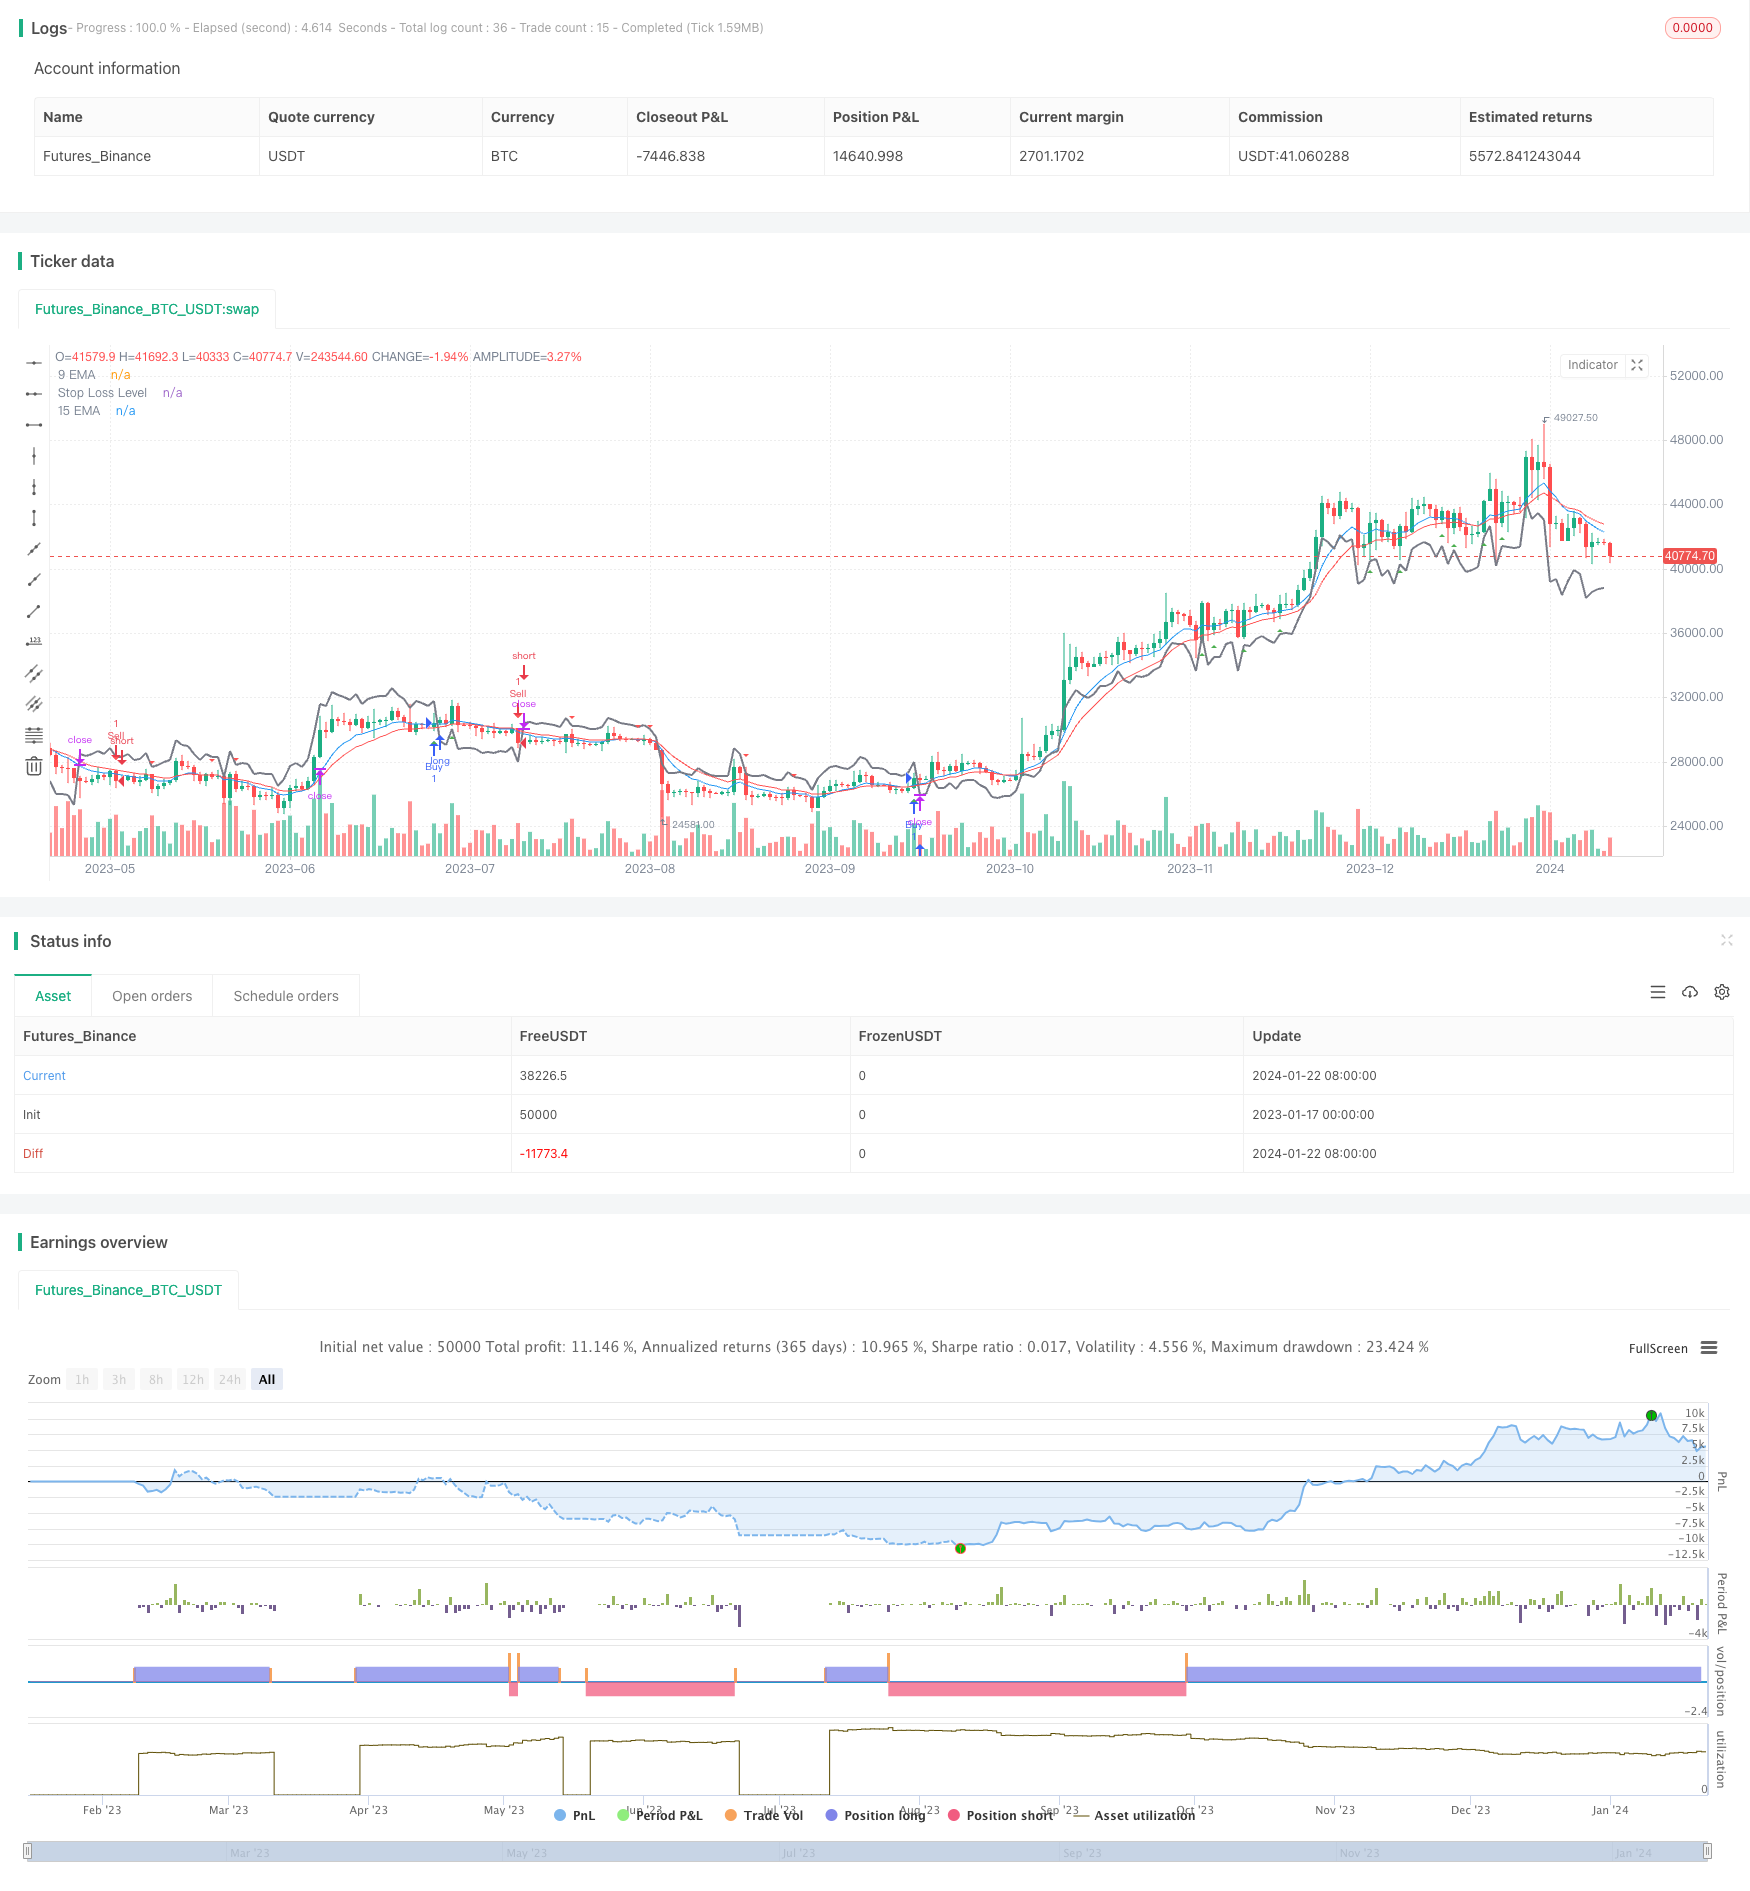
This strategy calculates the 9-day and 15-day exponential moving averages (EMA) to identify buy and sell signals based on EMA crosses and candlestick direction for intraday trading. It generates buy signals when the 9EMA crosses above the 15EMA and the last candlestick is bullish, and sell signals when the 9EMA crosses below the 15EMA and the last candlestick is bearish. The strategy also incorporates an ATR-based stop loss.
Strategy Logic
- Calculate the 9-day EMA and 15-day EMA
- Identify the direction of the last candlestick (bullish or bearish)
- Generate buy signal when 9EMA crosses above 15EMA and last candlestick is bullish
- Generate sell signal when 9EMA crosses below 15EMA and last candlestick is bearish
- Calculate ATR value using ATR indicator to plot stop loss during trade
Advantage Analysis
The advantages of this strategy include:
- Uses EMA combo to capture short-mid term trends
- Filters false signals using candlestick direction
- Employs dynamic ATR stop loss to control risk
- Short timeframe suitable for intraday scalping
- Simple to implement
Risk Analysis
The risks include:
- EMA has lagging effect, may miss some price moves
- EMA crossovers can cause whipsaws
- Prone to price fluctuations in intraday trading
- Stop loss too tight tends to get hit, too wide impacts profit
Solutions:
- Optimize EMA parameters
- Add other filters like MACD
- Dynamically adjust stop loss
- Optimize stop loss strategy
Optimization Directions
Areas for optimization:
- Test different EMA combos to find optimal periods
- Add other indicators, build multifactor model
- Add timeframe filter, signal only during certain periods
- Incorporate volatility index to adjust stop loss level
- Employ machine learning to dynamically optimize parameters
Summary
This is a simple yet effective intraday scalping strategy integrating dual EMA crossover and candlestick filtering with ATR-based dynamic stop loss. Further enhancements in parameters and multi-factor combinations can improve stability and profitability.
/*backtest
start: 2023-01-17 00:00:00
end: 2024-01-23 00:00:00
period: 1d
basePeriod: 1h
exchanges: [{"eid":"Futures_Binance","currency":"BTC_USDT"}]
*/

//@version=5
strategy("EMA Scalping Strategy", shorttitle="EMAScalp", overlay=true)

// Input parameters
ema9_length = input(9, title="9 EMA Length")
ema15_length = input(15, title="15 EMA Length")

// Calculate EMAs
ema9 = ta.ema(close, ema9_length)
ema15 = ta.ema(close, ema15_length)

// Plot EMAs on the chart
plot(ema9, color=color.blue, title="9 EMA")
plot(ema15, color=color.red, title="15 EMA")

// Identify Bullish and Bearish candles
bullish_candle = close > open
bearish_candle = close < open

// Bullish conditions for Buy Signal
buy_condition = ta.crossover(close, ema9) and ema15 < ema9 and bullish_candle

// Bearish conditions for Sell Signal
sell_condition = ta.crossunder(close, ema9) and ema15 > ema9 and bearish_candle

// Plot Buy and Sell signals
plotshape(series=buy_condition, title="Buy Signal", color=color.green, style=shape.triangleup, location=location.belowbar)
plotshape(series=sell_condition, title="Sell Signal", color=color.red, style=shape.triangledown, location=location.abovebar)

// Optional: Add stop-loss levels
atr_length = input(14, title="ATR Length for Stop Loss")
atr_multiplier = input(1.5, title="ATR Multiplier for Stop Loss")

atr_value = ta.atr(atr_length)
stop_loss_level = strategy.position_size > 0 ? close - atr_multiplier * atr_value : close + atr_multiplier * atr_value
plot(stop_loss_level, color=color.gray, title="Stop Loss Level", linewidth=2)

// Strategy rules
if (buy_condition)
    strategy.entry("Buy", strategy.long)
    strategy.exit("Exit Buy", from_entry="Buy", loss=stop_loss_level)

if (sell_condition)
    strategy.entry("Sell", strategy.short)
    strategy.exit("Exit Sell", from_entry="Sell", loss=stop_loss_level)