Overview
This is a trend-following strategy that combines 3 Exponential Moving Averages (EMAs) with the Directional Movement Index (DMI) and the Moving Average Convergence Divergence (MACD) indicator to determine the trend direction and generate buy/sell signals. The key components include EMA crossover signals, DMI for trend strength, and MACD for momentum confirmation.
Strategy Logic
The core logic relies on 3 EMAs - 34, 89, and 200 - calculated on the M5 timeframe to identify the overall trend. The 34-period EMA gives near-term direction, while the 89 and 200 EMAs define the medium and long-term trends respectively.
Buy signals are triggered when: - Close price crosses above 34 EMA - +DI (bullish directional movement) > 17 - ADX (trend strength) > -DI
Sell signals are generated when: - Close price crosses below 34 EMA - -DI (bearish directional movement) > 17 - ADX > +DI
Additional confirmation comes from the MACD indicator before entries.
Advantages
This strategy has several key advantages:
- Captures trend direction early using short-term EMA crossover
- Uses multiple EMAs to gauge trend strength on different timeframes
- DMI filters help avoid false signals by checking for strong directional movement
- MACD provides momentum confirmation for higher probability setups
- Combination of indicators improves accuracy and timing of entries
Risks
The main risks to consider:
- Whipsaws and false signals if using only EMA crossover
- Potential lag in signal generation from multiple confirmations
- Vulnerable to sudden trend reversals
Mitigation methods: - Use appropriate stop-loss, position sizing - Optimize EMA lengths for current market conditions - Watch price action for visual confirmation
Enhancement Opportunities
Further improvements for the strategy:
- Add additional filters like RSI for overbought/oversold levels
- Incorporate volume analysis for stronger signals
- Test and optimize indicators and settings based on asset and timeframe
- Employ machine learning to continually learn from new market data
Conclusion
In summary, this is a robust trend-following system combining simple yet powerful indicators to trade in the direction of the prevailing trend. The triple EMA configuration gauges multi-timeframe trends while DMI and MACD checks enhance timing and probability of profitable entries. With proper optimization and risk management, it can be an effective addition for trend traders.
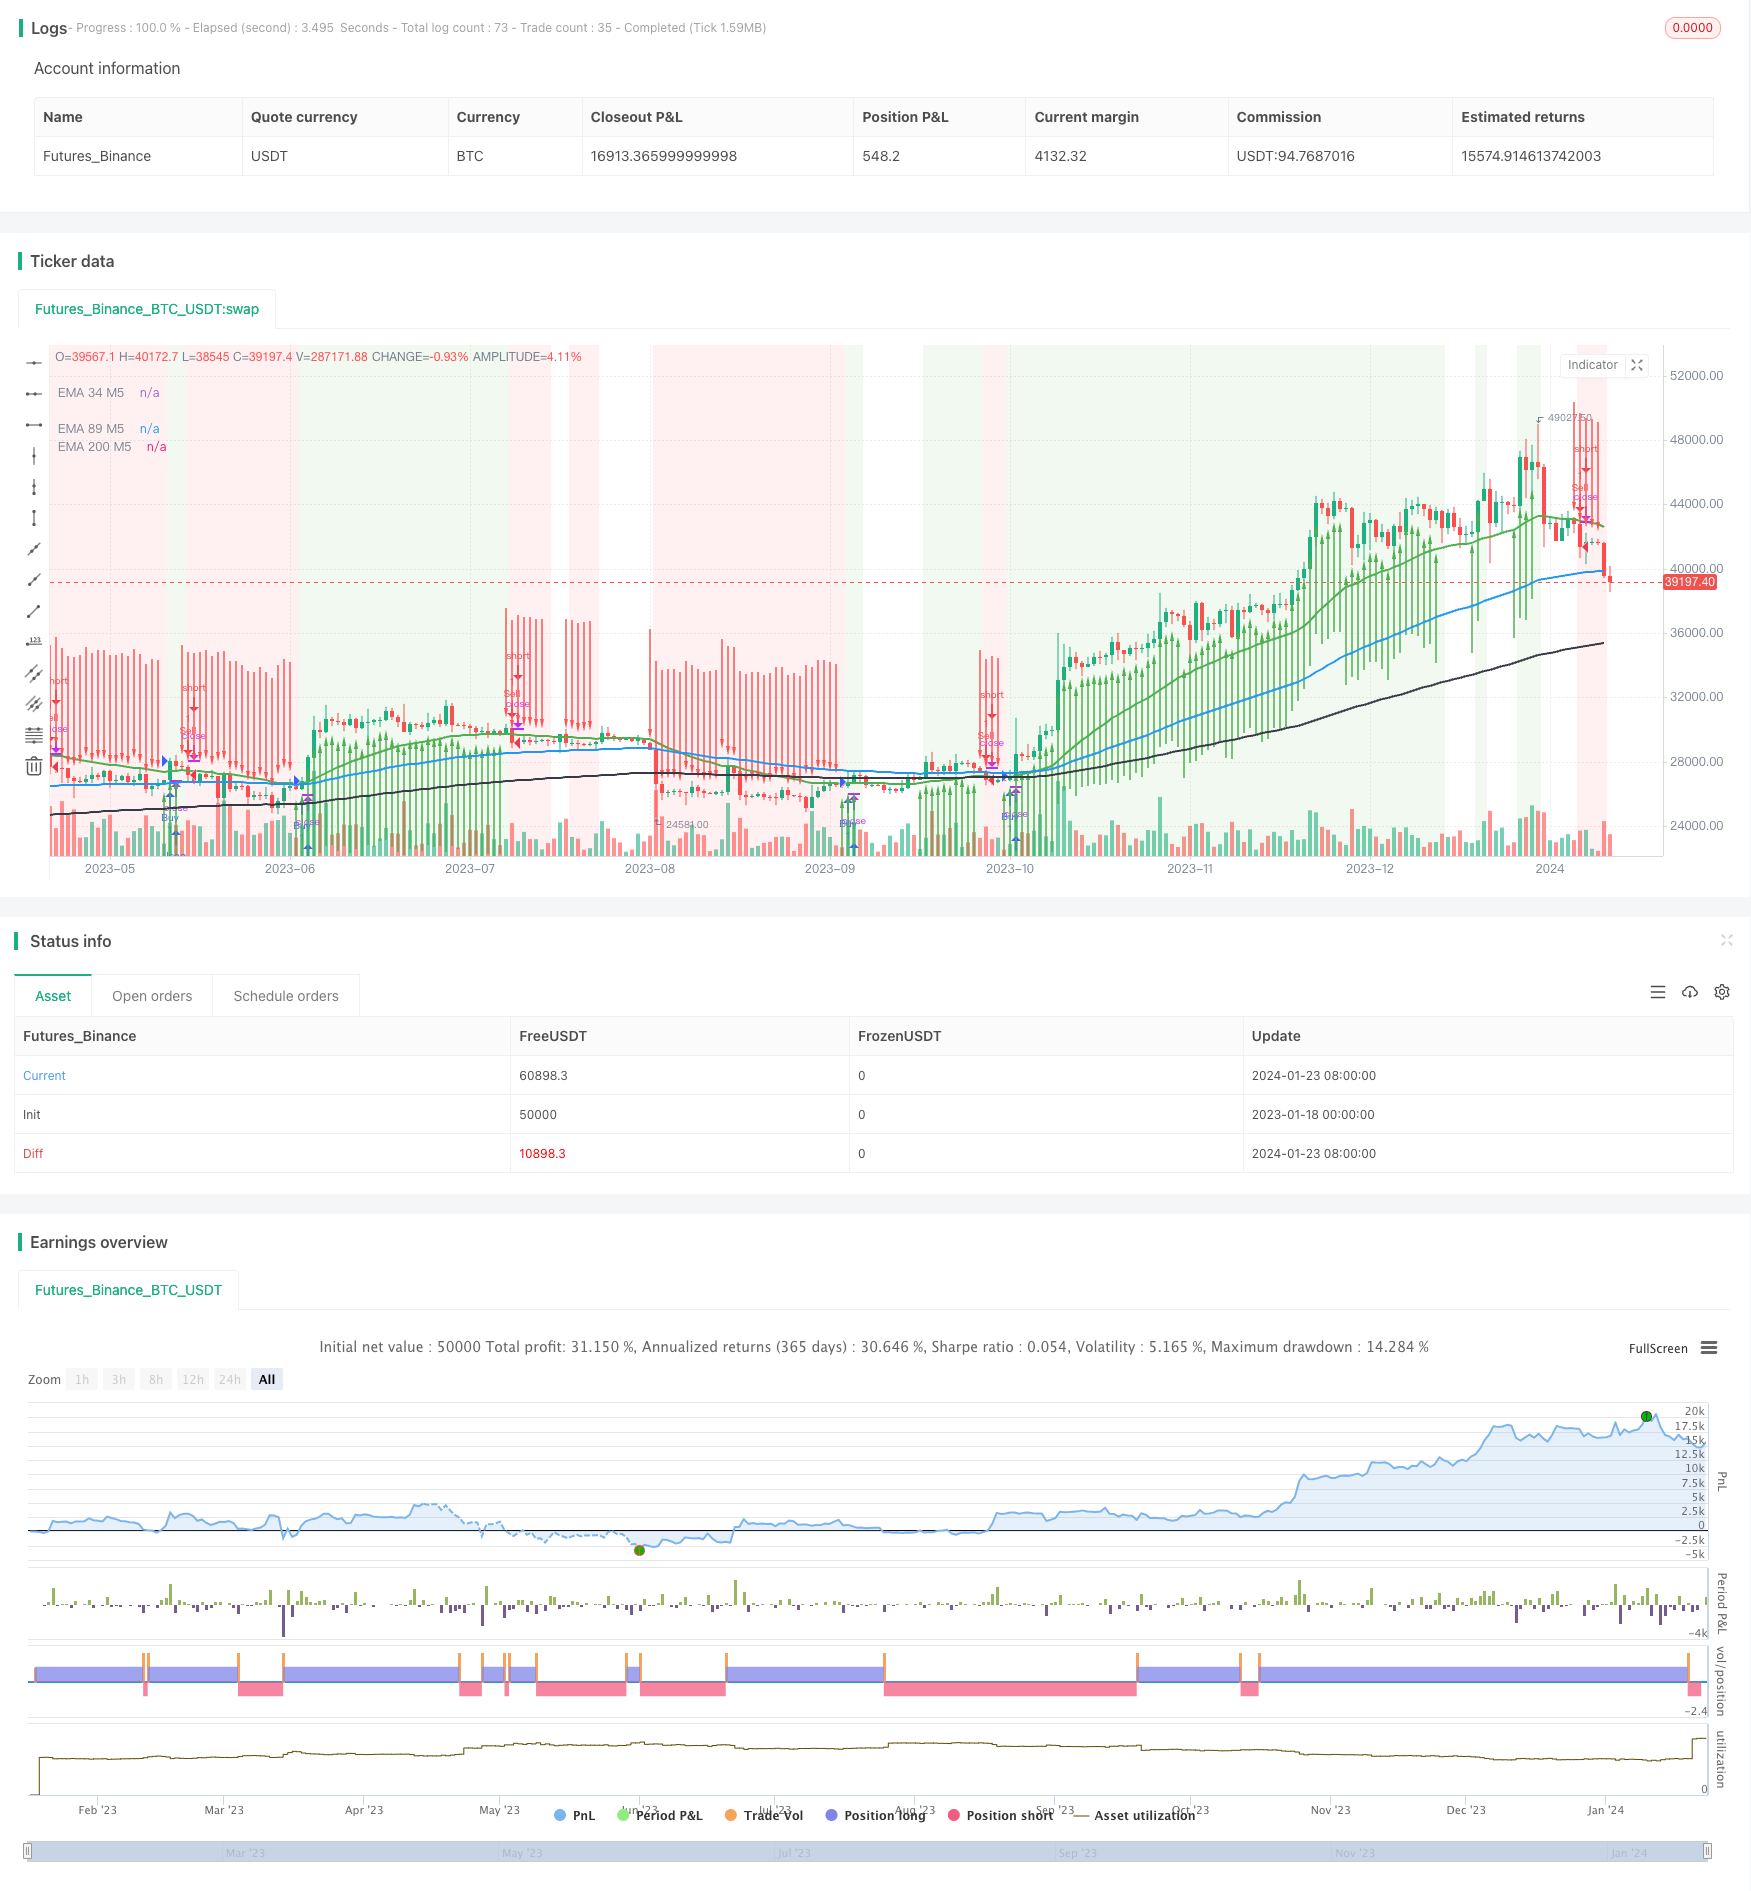
/*backtest
start: 2023-01-18 00:00:00
end: 2024-01-24 00:00:00
period: 1d
basePeriod: 1h
exchanges: [{"eid":"Futures_Binance","currency":"BTC_USDT"}]
*/

//@version=5
strategy("2 EMA di+ Buy Sell, strategy ", overlay=true)

// Define the EMA calculation function
ema(src, length) =>
    ta.ema(src, length)

// Calculate and plot EMA on M5
ema34_M5 = ema(close, 34)
ema89_M5 = ema(close, 89)
ema200_M5 = ema(close, 200)

// Plot EMAs
plot(ema34_M5, color=color.green, title="EMA 34 M5", linewidth=2)
plot(ema89_M5, color=color.blue, title="EMA 89 M5", linewidth=2)
plot(ema200_M5, color=color.black, title="EMA 200 M5", linewidth=2)

// Define DMI parameters
len = input(14, title="DI Length")
up = ta.change(high)
down = -ta.change(low)
plusDM = na(up) ? na : (up > down and up > 0 ? up : 0)
minusDM = na(down) ? na : (down > up and down > 0 ? down : 0)
trur = ta.rma(ta.tr, len)
plusDI = 100 * ta.rma(plusDM, len) / trur
minusDI = 100 * ta.rma(minusDM, len) / trur

// Calculate ADX
adxValue = 100 * ta.rma(math.abs(plusDI - minusDI) / (plusDI + minusDI == 0 ? 1 : plusDI + minusDI), len)

// Define MACD parameters
fastLength = input(12, title="Fast Length")
slowLength = input(26, title="Slow Length")
signalLength = input(9, title="Signal Length")

// Calculate MACD
[macdLine, signalLine, _] = ta.macd(close, fastLength, slowLength, signalLength)

// Create buy/sell conditions
buyCondition = close > ema34_M5 and plusDI > 17 and adxValue > minusDI
sellCondition = close < ema34_M5 and minusDI > 17 and adxValue > plusDI

// Strategy logic
strategy.entry("Buy", strategy.long, when = buyCondition)
strategy.entry("Sell", strategy.short, when = sellCondition)

// Create alerts for buy/sell signals
alertcondition(buyCondition, title="Buy Signal", message="Buy Signal")
alertcondition(sellCondition, title="Sell Signal", message="Sell Signal")

// Plot buy/sell arrows on the price chart
bgcolor(buyCondition ? color.new(color.green, 90) : sellCondition ? color.new(color.red, 90) : na)

plotarrow(buyCondition ? 1 : sellCondition ? -1 : na, colorup=color.new(color.green, 0), colordown=color.new(color.red, 0), offset=-1)