
The Momentum Pullback Strategy is a medium-term trading strategy that combines moving averages and candlestick patterns to identify trading opportunities by detecting breakouts and pullbacks. It is suitable for trading highly leveraged financial products like options and futures.
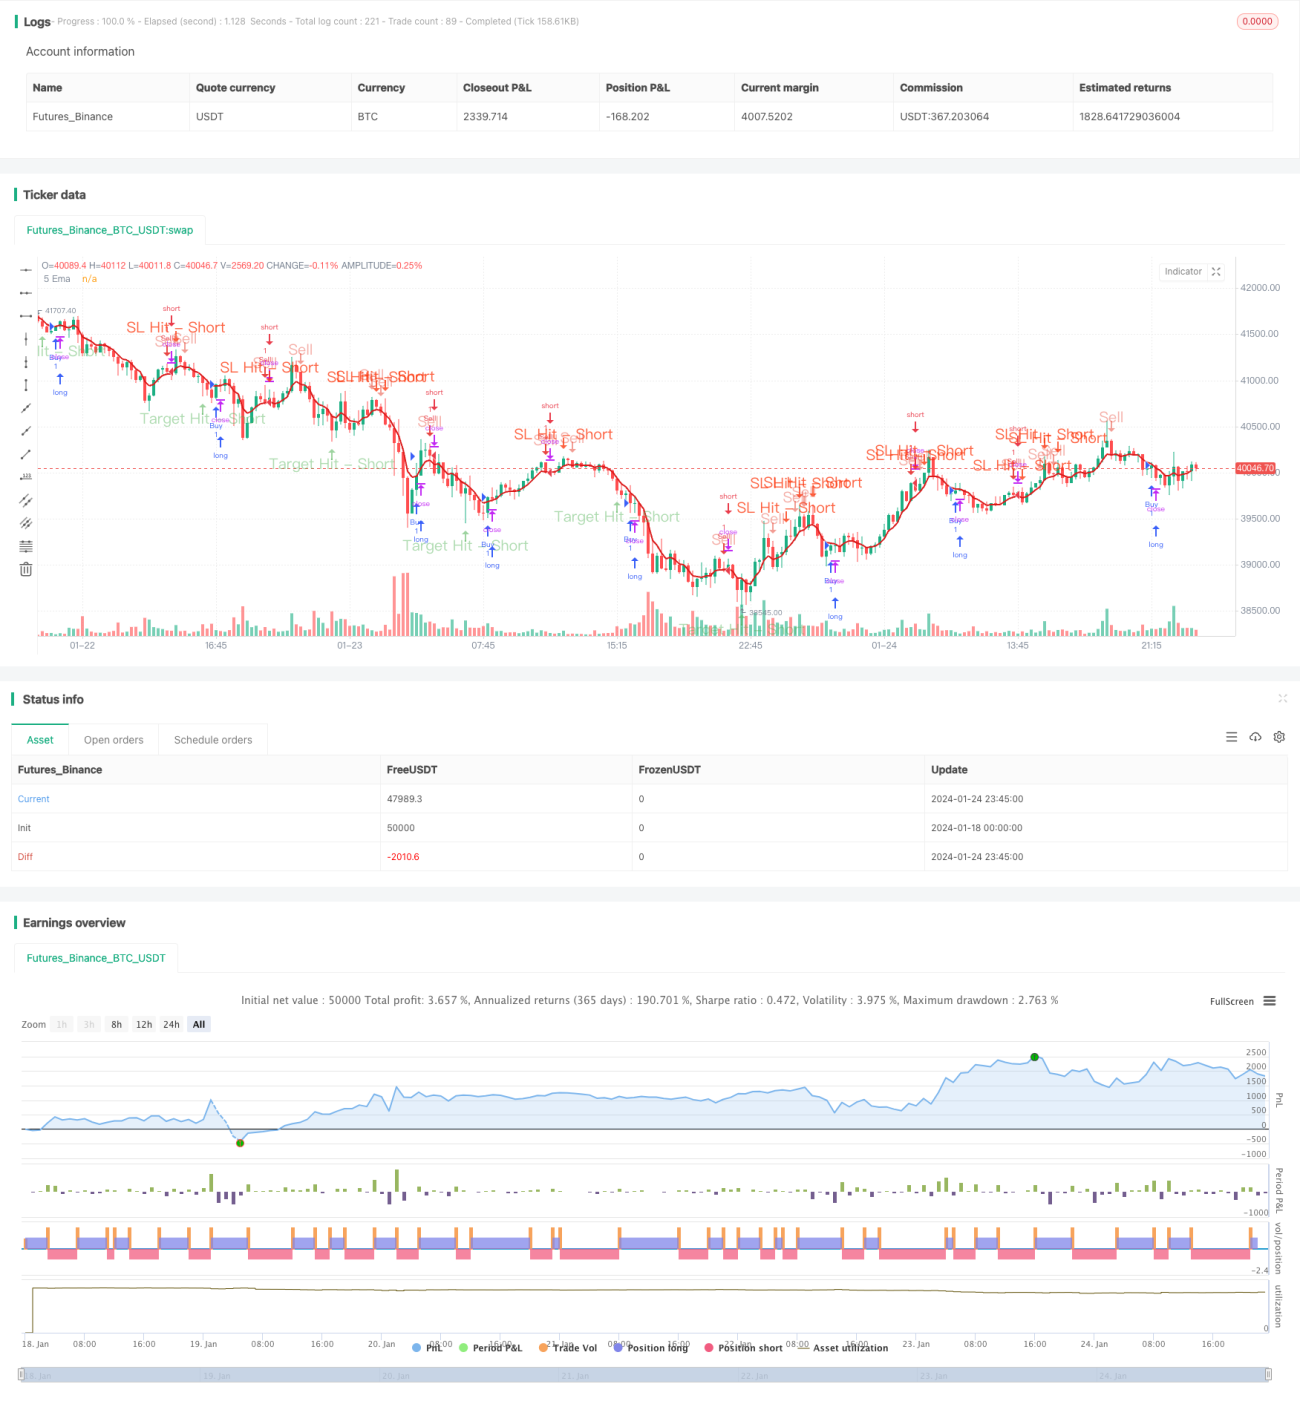
The core logic of this strategy is based on the 5-day simple moving average. When the price is about to break through this average line, it will form a gap high or low candlestick, which signals a potential long or short opportunity. The entry signal is triggered when the second candle closing beyond the moving average does not break the previous gap candle’s low or high. Stop loss and profit target levels are then set based on the risk-reward ratio.
When the price breaks above the 5-day MA and closes, the previous gap candle’s high is the stop loss level. The profit target is set by subtracting a certain retracement range from the low, multiplied by the desired risk-reward ratio. Similarly for a downside breakout, the previous gap candle’s low is the stop loss, while the take profit level is above the high plus a retracement range factored by the risk-reward ratio.
An optional filter is provided where the current candle’s close should be slightly lower or higher than the gap candle’s close for additional confirmation, avoiding false signals.
Risks can be reduced via sensible stop losses, position sizing, less frequent trading etc. Combining other indicators to filter signals is also an option.
Overall this is an easy to understand and implement medium-term trading strategy. It capitalizes on trend reversals identified by moving averages and gap candles, with a rational risk control framework. While further improvements are possible, the core logic is versatile for wider application via parameter tuning, signal filtering etc.
/*backtest
start: 2024-01-18 00:00:00
end: 2024-01-25 00:00:00
period: 15m
basePeriod: 5m
exchanges: [{"eid":"Futures_Binance","currency":"BTC_USDT"}]
*/
// This source code is subject to the terms of the Mozilla Public License 2.0 at https://mozilla.org/MPL/2.0/
// © TradingInsights2
//@version=5
strategy("Ultimate 5EMA Strategy By PowerOfStocks", overlay=true)
Eusl = input.bool(false, title="Enable the Extra SL shown below")
usl = input.int(defval=5, title='Value to set SL number of points below-low or above-high', minval=1, maxval=100)
RiRe = input.int(defval=3, title='Risk to Reward Ratio', minval=1, maxval=25)
ShowSell = input.bool(true, 'Show Sell Signals')
ShowBuy = input.bool(false, 'Show Buy Signals')
BSWCon = input.bool(defval=false, title='Buy/Sell with Extra Condition - candle close')
// Moving Average
ema5 = ta.ema(close, 5)
pema5 = plot(ema5, '5 Ema', color=color.new(#da1a1a, 0), linewidth=2)
var bool Short = na
var bool Long = na
var shortC = 0
var sslhitC = 0
var starhitC = 0
var float ssl = na
var float starl = na
var float star = na
var float sellat = na
var float alert_shorthigh = na
var float alert_shortlow = na
var line lssl = na
var line lstar = na
var line lsell = na
var label lssllbl = na
var label lstarlbl = na
var label lselllbl = na
var longC = 0
var lslhitC = 0
var ltarhitC = 0
var float lsl = na
var float ltarl = na
var float ltar = na
var float buyat = na
var float alert_longhigh = na
var float alert_longlow = na
var line llsl = na
var line lltar = na
var line lbuy = na
var label llsllbl = na
var label lltarlbl = na
var label lbuylbl = na
ShortWC = low[1] > ema5[1] and low[1] > low and shortC == 0 and close < close[1]
ShortWOC = low[1] > ema5[1] and low[1] > low and shortC == 0
Short := BSWCon ? ShortWC : ShortWOC
sslhit = high > ssl and shortC > 0 and sslhitC == 0
starhit = low < star and shortC > 0 and starhitC == 0
LongWC = high[1] < ema5[1] and high[1] < high and longC == 0 and close > close[1]
LongWOC = high[1] < ema5[1] and high[1] < high and longC == 0
Long := BSWCon ? LongWC : LongWOC
lslhit = low < lsl and longC > 0 and lslhitC == 0
ltarhit = high > ltar and longC > 0 and ltarhitC == 0
if Short and ShowSell
shortC := shortC + 1
sslhitC := 0
starhitC := 0
alert_shorthigh := high[1]
if Eusl
ssl := high[1] + usl
starl := BSWCon ? ((high[1] - close) + usl) * RiRe : ((high[1] - low[1]) + usl) * RiRe
else
ssl := high[1]
starl := BSWCon ? (high[1] - close) * RiRe : (high[1] - low[1]) * RiRe
star := BSWCon ? close - starl : low[1] - starl
sellat := BSWCon ? close : low[1]
// lssl := line.new(bar_index, ssl, bar_index, ssl, color=color.new(#fc2d01, 45), style=line.style_dashed)
// lstar := line.new(bar_index, star, bar_index, star, color=color.new(color.green, 45), style=line.style_dashed)
// lsell := line.new(bar_index, sellat, bar_index, sellat, color=color.new(color.orange, 45), style=line.style_dashed)
// lssllbl := label.new(bar_index, ssl, style=label.style_none, text='Stop Loss - Short' + ' (' + str.tostring(ssl) + ')', textcolor=color.new(#fc2d01, 35), color=color.new(#fc2d01, 35))
// lstarlbl := label.new(bar_index, star, style=label.style_none, text='Target - Short' + ' (' + str.tostring(star) + ')', textcolor=color.new(color.green, 35), color=color.new(color.green, 35))
// lselllbl := label.new(bar_index, sellat, style=label.style_none, text='Sell at' + ' (' + str.tostring(sellat) + ')', textcolor=color.new(color.orange, 35), color=color.new(color.orange, 35))
if sslhit == false and starhit == false and shortC > 0
// line.set_x2(lssl, bar_index)
// line.set_x2(lstar, bar_index)
// line.set_x2(lsell, bar_index)
sslhitC := 0
starhitC := 0
else
if sslhit
shortC := 0
sslhitC := sslhitC + 1
else
if starhit
shortC := 0
starhitC := starhitC + 1
if Long and ShowBuy
longC := longC + 1
lslhitC := 0
ltarhitC := 0
alert_longlow := low[1]
if Eusl
lsl := low[1] - usl
ltarl := BSWCon ? ((close - low[1]) + usl) * RiRe : ((high[1] - low[1]) + usl) * RiRe
else
lsl := low[1]
ltarl := BSWCon ? (close - low[1]) * RiRe : (high[1] - low[1]) * RiRe
ltar := BSWCon ? close + ltarl : high[1] + ltarl
buyat := BSWCon ? close : high[1]
llsl := line.new(bar_index, lsl, bar_index, lsl, color=color.new(#fc2d01, 45), style=line.style_dotted)
lltar := line.new(bar_index, ltar, bar_index, ltar, color=color.new(color.green, 45), style=line.style_dotted)
lbuy := line.new(bar_index, buyat, bar_index, buyat, color=color.new(color.orange, 45), style=line.style_dotted)
llsllbl := label.new(bar_index, lsl, style=label.style_none, text='Stop Loss - Long' + ' (' + str.tostring(lsl) + ')', textcolor=color.new(#fc2d01, 35), color=color.new(#fc2d01, 35))
lltarlbl := label.new(bar_index, ltar, style=label.style_none, text='Target - Long' + ' (' + str.tostring(ltar) + ')', textcolor=color.new(color.green, 35), color=color.new(color.green, 35))
lbuylbl := label.new(bar_index, buyat, style=label.style_none, text='Buy at' + ' (' + str.tostring(buyat) + ')', textcolor=color.new(color.orange, 35), color=color.new(color.orange, 35))
if lslhit == false and ltarhit == false and longC > 0
// line.set_x2(llsl, bar_index)
// line.set_x2(lltar, bar_index)
// line.set_x2(lbuy, bar_index)
lslhitC := 0
ltarhitC := 0
else
if lslhit
longC := 0
lslhitC := lslhitC + 1
else
if ltarhit
longC := 0
ltarhitC := ltarhitC + 1
strategy.entry("Buy", strategy.long, when=Long)
strategy.entry("Sell", strategy.short, when=Short)
strategy.close("ExitBuy", when=sslhit or starhit)
strategy.close("ExitSell", when=lslhit or ltarhit)
plotshape(ShowSell and Short, title='Sell', location=location.abovebar, offset=0, color=color.new(#e74c3c, 45), style=shape.arrowdown, size=size.normal, text='Sell', textcolor=color.new(#e74c3c, 55))
plotshape(ShowSell and sslhit, title='SL Hit - Short', location=location.abovebar, offset=0, color=color.new(#fc2d01, 25), style=shape.arrowdown, size=size.normal, text='SL Hit - Short', textcolor=color.new(#fc2d01, 25))
plotshape(ShowSell and starhit, title='Target Hit - Short', location=location.belowbar, offset=0, color=color.new(color.green, 45), style=shape.arrowup, size=size.normal, text='Target Hit - Short', textcolor=color.new(color.green, 55))
plotshape(ShowBuy and Long, title='Buy', location=location.belowbar, offset=0, color=color.new(#2ecc71, 45), style=shape.arrowup, size=size.normal, text='Buy', textcolor=color.new(#2ecc71, 55))
plotshape(ShowBuy and lslhit, title='SL Hit - Long', location=location.belowbar, offset=0, color=color.new(#fc2d01, 25), style=shape.arrowdown, size=size.normal, text='SL Hit - Long', textcolor=color.new(#fc2d01, 25))
plotshape(ShowBuy and ltarhit, title='Target Hit - Long', location=location.abovebar, offset=0, color=color.new(color.green, 45), style=shape.arrowup, size=size.normal, text='Target Hit - Long', textcolor=color.new(color.green, 55))
if ShowSell and Short
alert("Go Short@ " + str.tostring(sellat) + " : SL@ " + str.tostring(ssl) + " : Target@ " + str.tostring(star) + " ", alert.freq_once_per_bar )
if ShowBuy and Long
alert("Go Long@ " + str.tostring(buyat) + " : SL@ " + str.tostring(lsl) + " : Target@ " + str.tostring(ltar) + " ", alert.freq_once_per_bar )
///// End of code