Overview
This strategy combines the moving average and trading volume indicators to design the long and short entry and exit rules, forming a complete quantitative trading strategy.
Strategy Principle
Key Indicators
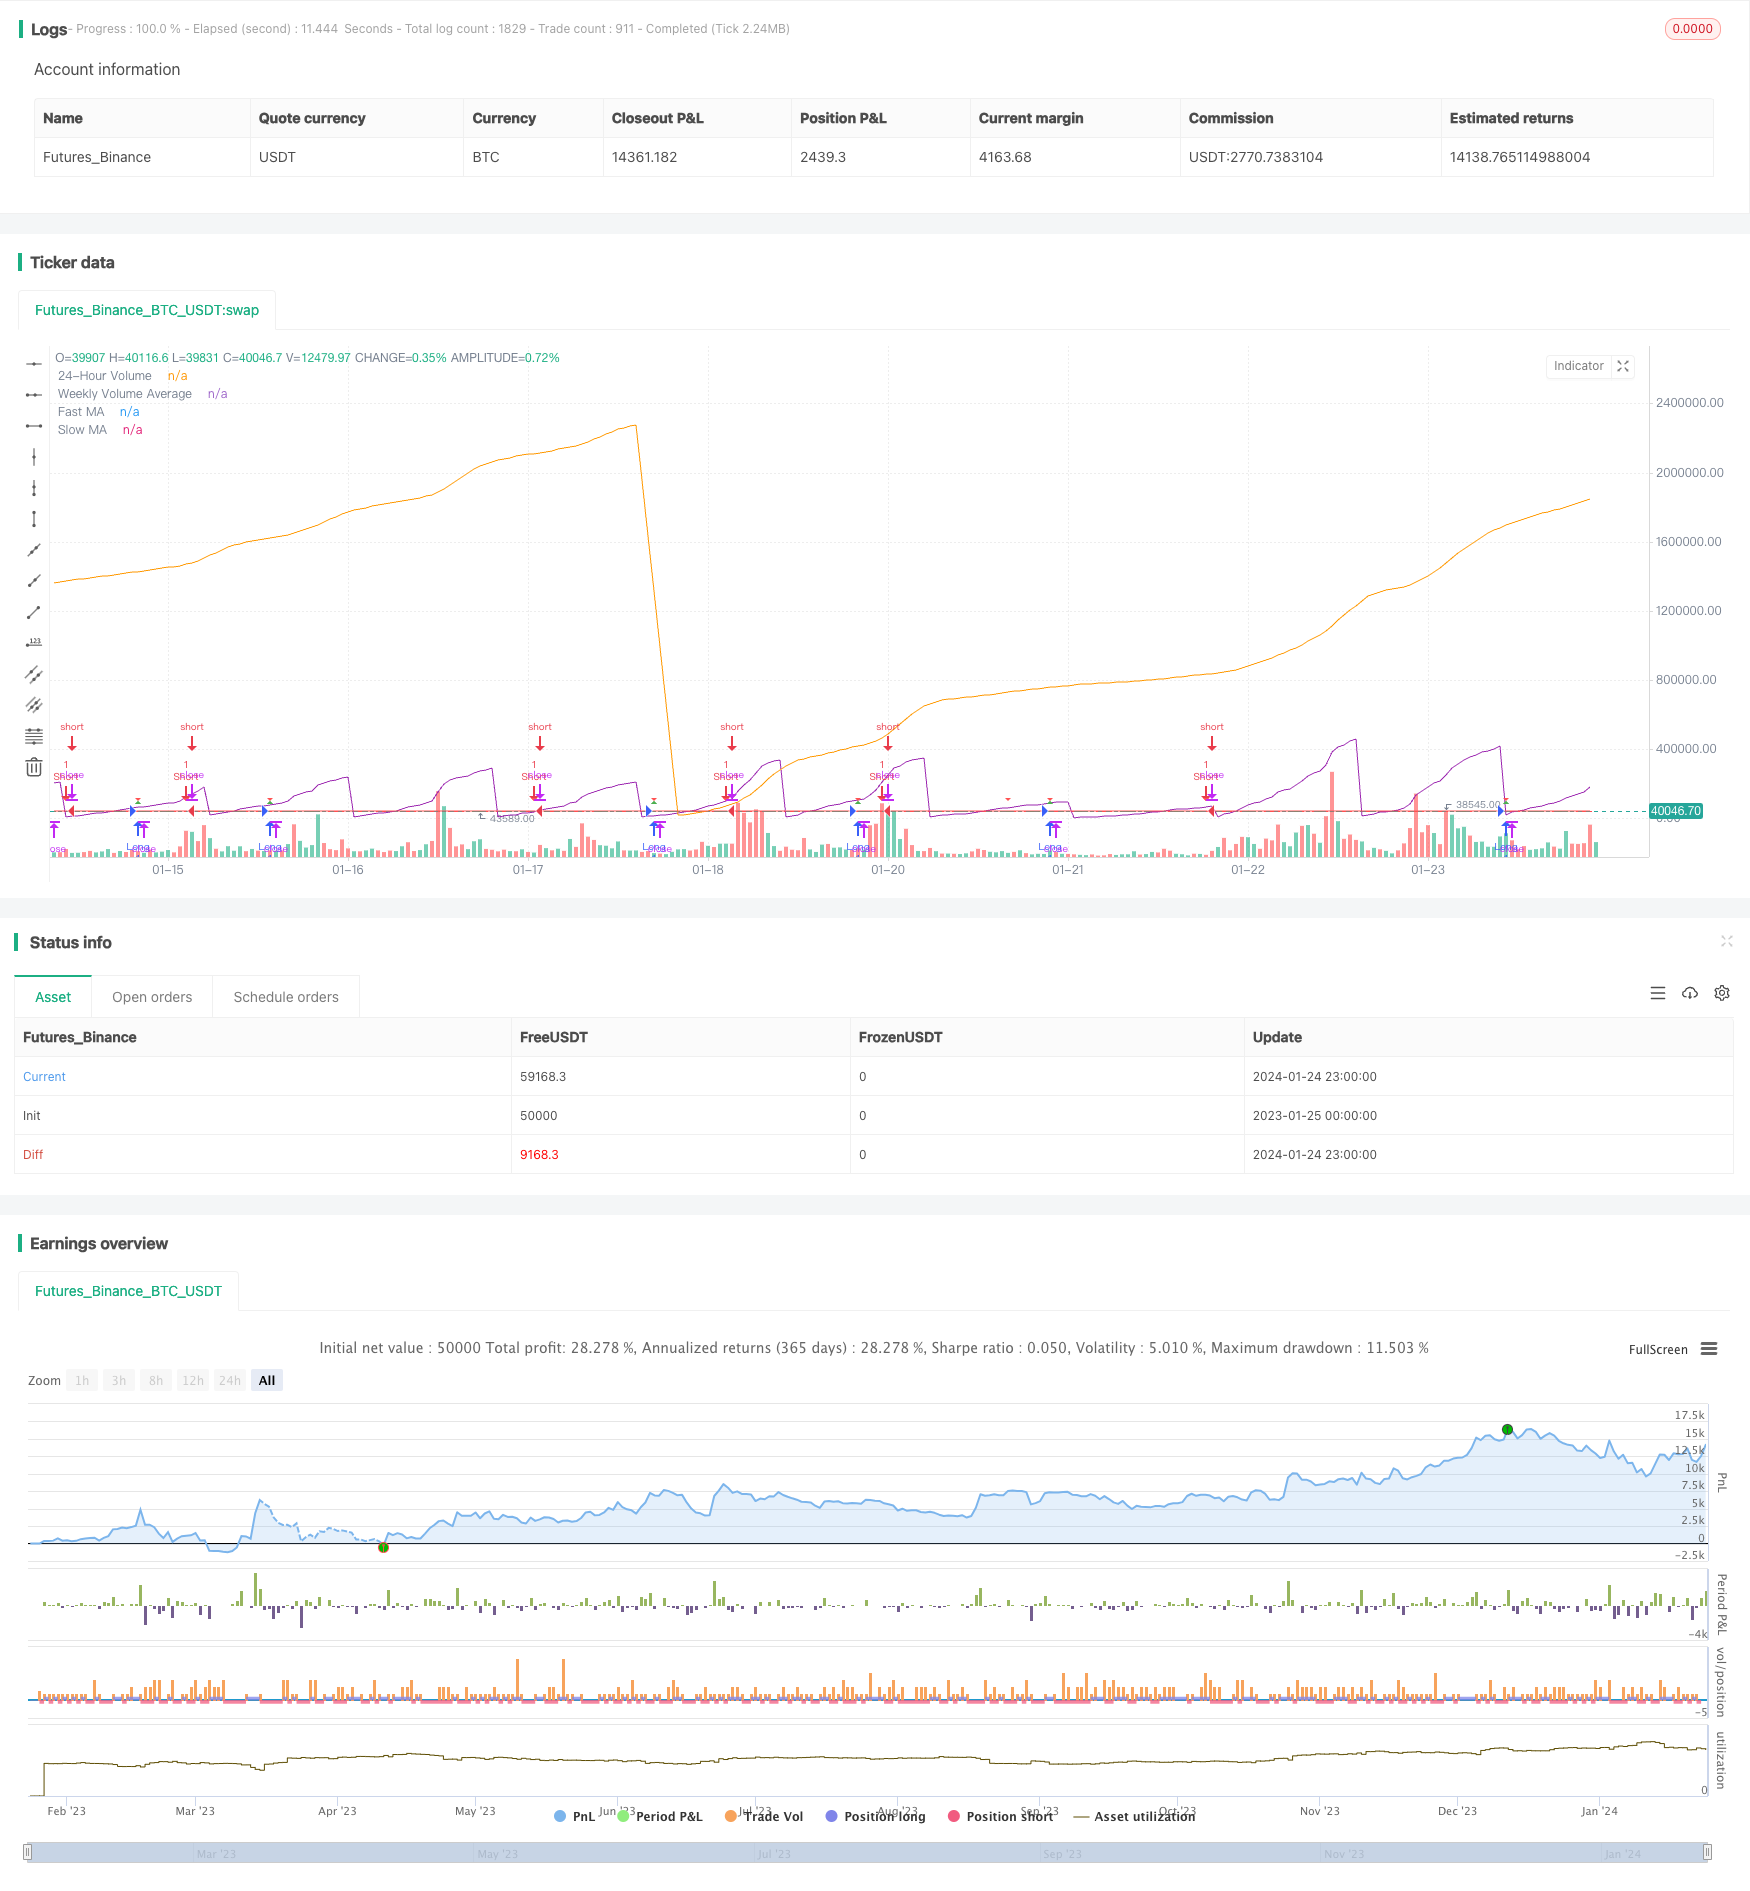
- Moving Averages: Fast MA (Blue Line) and Slow MA (Red Line)
- Volume: 24-hour Volume (Purple) and 7-day Average Volume (Orange)
Strategy Conditions
Long Entry Conditions:
- Fast MA crosses above Slow MA
- 24-hour Volume below 50% of 7-day Average Volume
Short Entry Conditions:
Fast MA crosses below Slow MA
Entries and Exits
Long Entry: Go long when long conditions are met
Short Entry: Go short when short conditions are met
Take Profit and Stop Loss: Displayed take profit and stop loss levels for long position
Advantage Analysis
- Combining price and volume avoid false breakout
- Clear entry and exit rules
- Take profit and stop loss to control risk
Risk Analysis
- Frequent trading with moving average strategy
- Unreliable volume data quality
- Overoptimization in parameter tuning
Improvements:
- Adjust MA parameters to reduce trading frequency
- Verify signals with more data sources
- Strict backtesting to prevent overoptimization
Optimization Directions
- Add other indicators to filter signals
- Dynamic take profit and stop loss
- Multiple timeframe analysis to improve stability
Summary
This strategy integrates MA and volume indicators to design a complete quant strategy with clear entry conditions, take profit/stop loss, easy to operate. Need to prevent frequent trading issue, monitor volume data quality and overoptimization. NEXT steps are multivariate optimization, dynamic TP/SL and multiple timeframe analysis.
/*backtest
start: 2023-01-25 00:00:00
end: 2024-01-25 00:00:00
period: 1h
basePeriod: 15m
exchanges: [{"eid":"Futures_Binance","currency":"BTC_USDT"}]
*/

//@version=5
strategy("MA and Volume Strategy", overlay=true)

// Input parameters
fastLength = input(9, title="Fast MA Length")
slowLength = input(21, title="Slow MA Length")
volumePercentageThreshold = input(50, title="Volume Percentage Threshold")

// Calculate moving averages
fastMA = ta.sma(close, fastLength)
slowMA = ta.sma(close, slowLength)

// Calculate 24-hour volume and weekly volume average
dailyVolume = request.security(syminfo.tickerid, "D", volume)
weeklyVolumeAvg = ta.sma(request.security(syminfo.tickerid, "W", volume), 7)

// Strategy conditions
longCondition = ta.crossover(fastMA, slowMA) and dailyVolume < (weeklyVolumeAvg * volumePercentageThreshold / 100)
shortCondition = ta.crossunder(fastMA, slowMA)

// Set take profit and stop loss levels
takeProfitLong = close * 1.50
stopLossLong = close * 0.90

// Strategy orders
strategy.entry("Long", strategy.long, when=longCondition)
strategy.entry("Short", strategy.short, when=shortCondition)

// Plot moving averages
plot(fastMA, color=color.blue, title="Fast MA")
plot(slowMA, color=color.red, title="Slow MA")

// Plot 24-hour volume and weekly volume average
plot(dailyVolume, color=color.purple, title="24-Hour Volume", transp=0)
plot(weeklyVolumeAvg, color=color.orange, title="Weekly Volume Average")

// Plot entry signals
plotshape(series=longCondition, title="Buy Signal", color=color.green, style=shape.triangleup, size=size.small)
plotshape(series=shortCondition, title="Sell Signal", color=color.red, style=shape.triangledown, size=size.small)

// Plot take profit and stop loss levels only when a valid trade is active
plotshape(series=longCondition, title="Take Profit Long", color=color.green, style=shape.triangleup, size=size.small)
plotshape(series=longCondition, title="Stop Loss Long", color=color.red, style=shape.triangledown, size=size.small)