Overview
This strategy is a bitcoin trading strategy designed based on the Ichimoku cloud indicator. It generates trading signals when the short-term line crosses over the long-term line by calculating the equilibrium prices over different periods.
Strategy Logic
The strategy uses the Ichimoku cloud indicator. The specific formulas are:
Lmax = highest price over period_max
Smax = lowest price over period_max
Lmed = highest price over period_med
Smed = lowest price over period_med
Lmin = highest price over period_min
Smin = lowest price over period_min
HL1 = (Lmax + Smax + Lmed + Smed)/4
HL2 = (Lmed + Smed + Lmin + Smin)/4
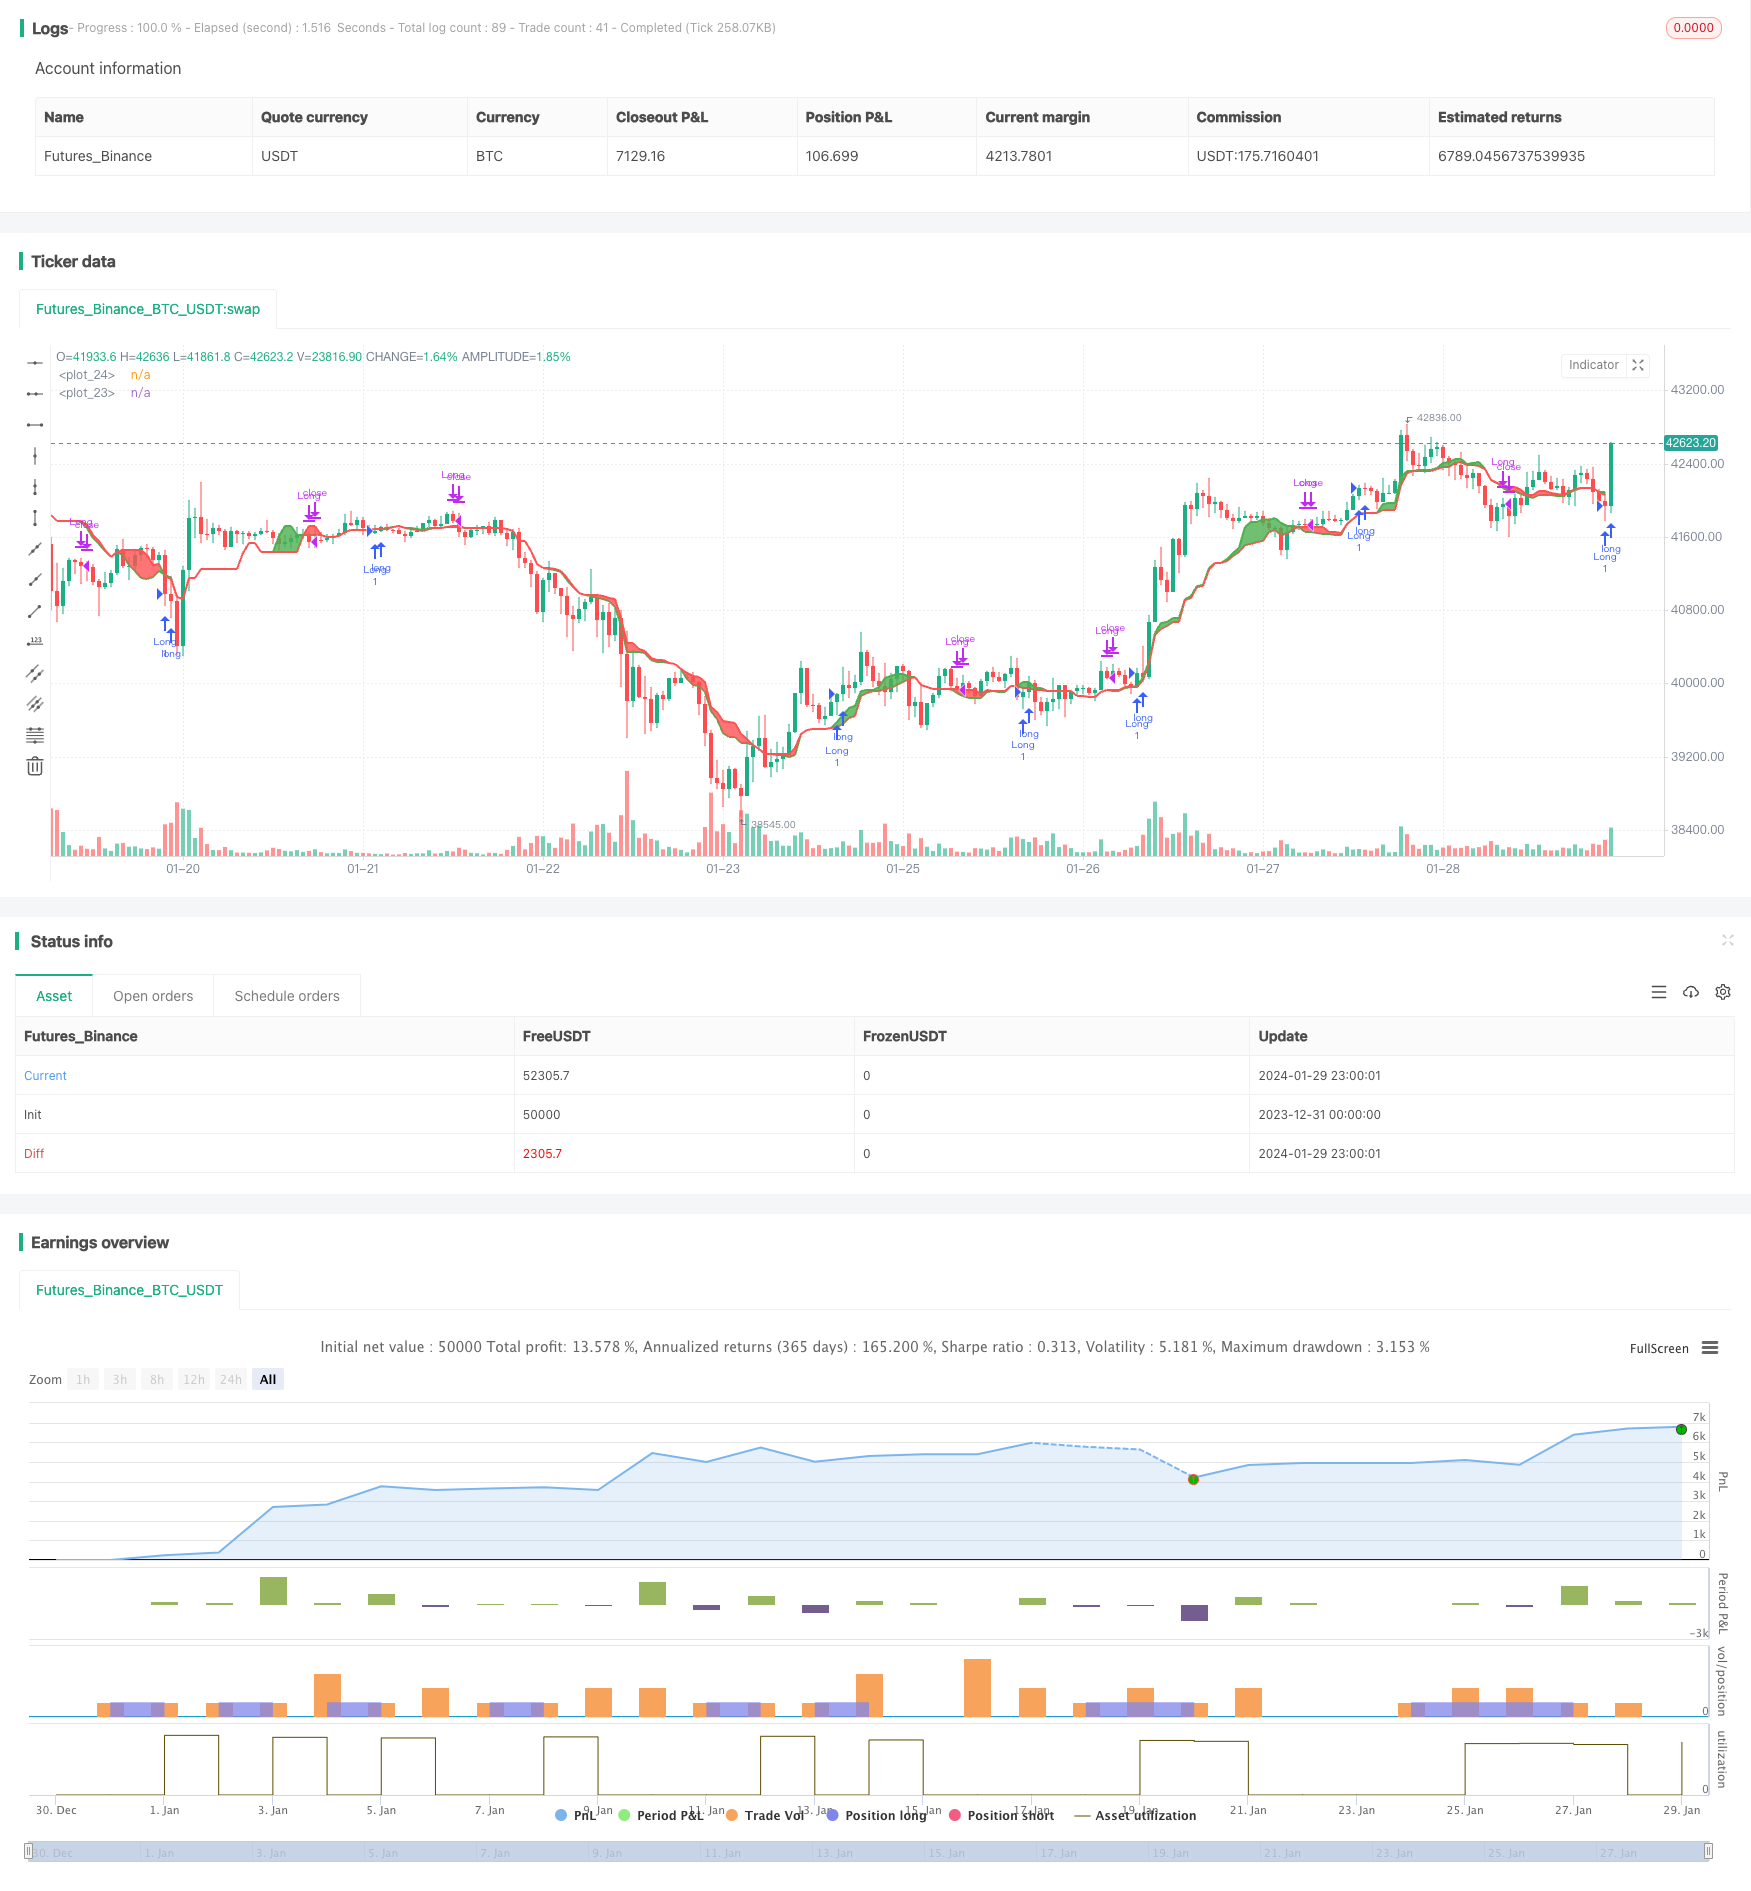
It calculates the equilibrium prices for the long-term line HL1 and short-term line HL2. A long signal is generated when HL2 crosses over HL1. A close signal is generated when HL2 crosses below HL1.
Advantage Analysis
The advantages of this strategy include:
- Using Ichimoku cloud filters market noise and identifies trends effectively.
- Crossover of different period lines generates trading signals and reduces false signals.
- The logic is simple and easy to understand and implement.
- Customizable period parameters adapt to different market environments.
Risk Analysis
There are also some risks:
- Ichimoku cloud has lagging and may miss short-term signals.
- Crossover of long and short term lines can be vulnerable to arbitrage.
- Signals may become unreliable during high volatility.
These risks can be reduced by optimizing parameters or incorporating other indicators.
Optimization Directions
The strategy can be optimized in the following aspects:
- Optimize long and short term periods to adapt to market changes.
- Add stop loss to control losses.
- Incorporate other indicators like MACD to improve accuracy.
- Suspend trading at high volatility periods to avoid huge losses.
Conclusion
This strategy generates signals when short-term equilibrium line crosses over long-term line based on Ichimoku cloud. Compared to single indicators, it effectively filters out false signals. Further improvements on parameters and risk control can enhance its stability and profitability.
/*backtest
start: 2023-12-31 00:00:00
end: 2024-01-30 00:00:00
period: 1h
basePeriod: 15m
exchanges: [{"eid":"Futures_Binance","currency":"BTC_USDT"}]
*/

// This source code is subject to the terms of the Mozilla Public License 2.0 at https://mozilla.org/MPL/2.0/
// © Alferow

//@version=4
strategy("BTC_ISHIMOKU", overlay=true)

period_max = input(20, minval = 1)
period_med = input(10, minval = 1)
period_min = input(16, minval = 1)

Lmax = highest(high, period_max)
Smax = lowest(low, period_max)

Lmed = highest(high, period_med)
Smed = lowest(low, period_med)

Lmin = highest(high, period_min)
Smin = lowest(low, period_min)

HL1 = (Lmax + Smax + Lmed + Smed)/4
HL2 = (Lmed + Smed + Lmin + Smin)/4

p1 = plot(HL1, color = color.red, linewidth = 2)
p2 = plot(HL2, color = color.green, linewidth = 2)

fill(p1, p2, color = HL1 < HL2 ? color.green : color.red, transp = 90)

start = timestamp(input(2020, minval=1), 01, 01, 00, 00)
finish = timestamp(input(2025, minval=1),01, 01, 00, 00)
trig = time > start and time < finish ? true : false

strategy.entry("Long", true, when = crossover(HL2, HL1) and trig)
// strategy.entry("Short", false, when = crossunder(HL2, HL1) and trig)
strategy.close("Long", when = crossunder(HL2, HL1) and trig)