Overview
This strategy adopts multiple indicators such as Bollinger Bands, RSI, ADX, MACD to judge market trends and has strong trend identification capability. It takes trend following strategy when indicator signals are bullish simultaneously. It closes positions to stop loss when indicator signals are bearish simultaneously.
Strategy Principle
- Use Bollinger Bands to judge whether price is near upper or lower rail to determine whether a trend is formed
- Combine with RSI indicator to avoid overbought and oversold areas to prevent false breakouts
- Use ADX to determine trend strength and only signal when trend strength is strong
- Adopt MACD to judge consistency of short-term and long-term trends
- Limit to trading sessions to avoid overnight risks
Through the combination judgement of multiple indicators, it can accurately identify price trends and timely track them when trend occurs to achieve excess returns.
Advantage Analysis
The biggest advantage of this strategy is that the indicator combination judgement is more comprehensive and accurate, which can effectively identify price trends and avoid false signals caused by single indicators.
Specifically, the advantages are:
- Bollinger Bands can determine price fluctuation range and strength
- RSI avoids buying in overbought areas and selling in oversold areas
- ADX determines trend strength, only follows strong trends
- MACD judges consistency of short and long term
- Limits trading sessions to avoid overnight risks
Through indicator combination judgement, it can maximize reduce false signals and enhance stability of the strategy.
Risk Analysis
The main risks of this strategy come from:
- Market events causing indicator failure
- Frequent false signals in range-bound markets
For risk 1, reliance on multiple indicators can mitigate the problem of single indicator failure to some extent, but risk management mechanisms still need to be improved.
For risk 2, parameters can be adjusted appropriately to narrow trading range and reduce trading frequency to mitigate risks.
Optimization Directions
The main optimizable aspects of this strategy include:
- Add stop loss mechanisms such as trailing stop loss, time stop loss, breakout stop loss, etc. to avoid pulling back too deep
- Optimize parameters, adjust indicator parameters combination to find optimum
- Add filters such as volume filter to avoid false breakouts in low volume
- Incorporate more indicators like KDJ, OBV to improve signal accuracy
- Adopt machine learning methods to auto-optimize parameters
By continuous optimization, continuously improve parameter robustness and reduce probabilities of false signals.
Summary
Overall this strategy has relatively strong capability of identifying trend signals through indicator combination judgements which can effectively identify price trends.
But it also has certain risks, risk management and parameter optimization needs to be continuously improved for steady long-term operations. If methods like machine learning can be introduced later to achieve auto-optimization of parameters, it will greatly enhance robustness and profitability of the strategy.
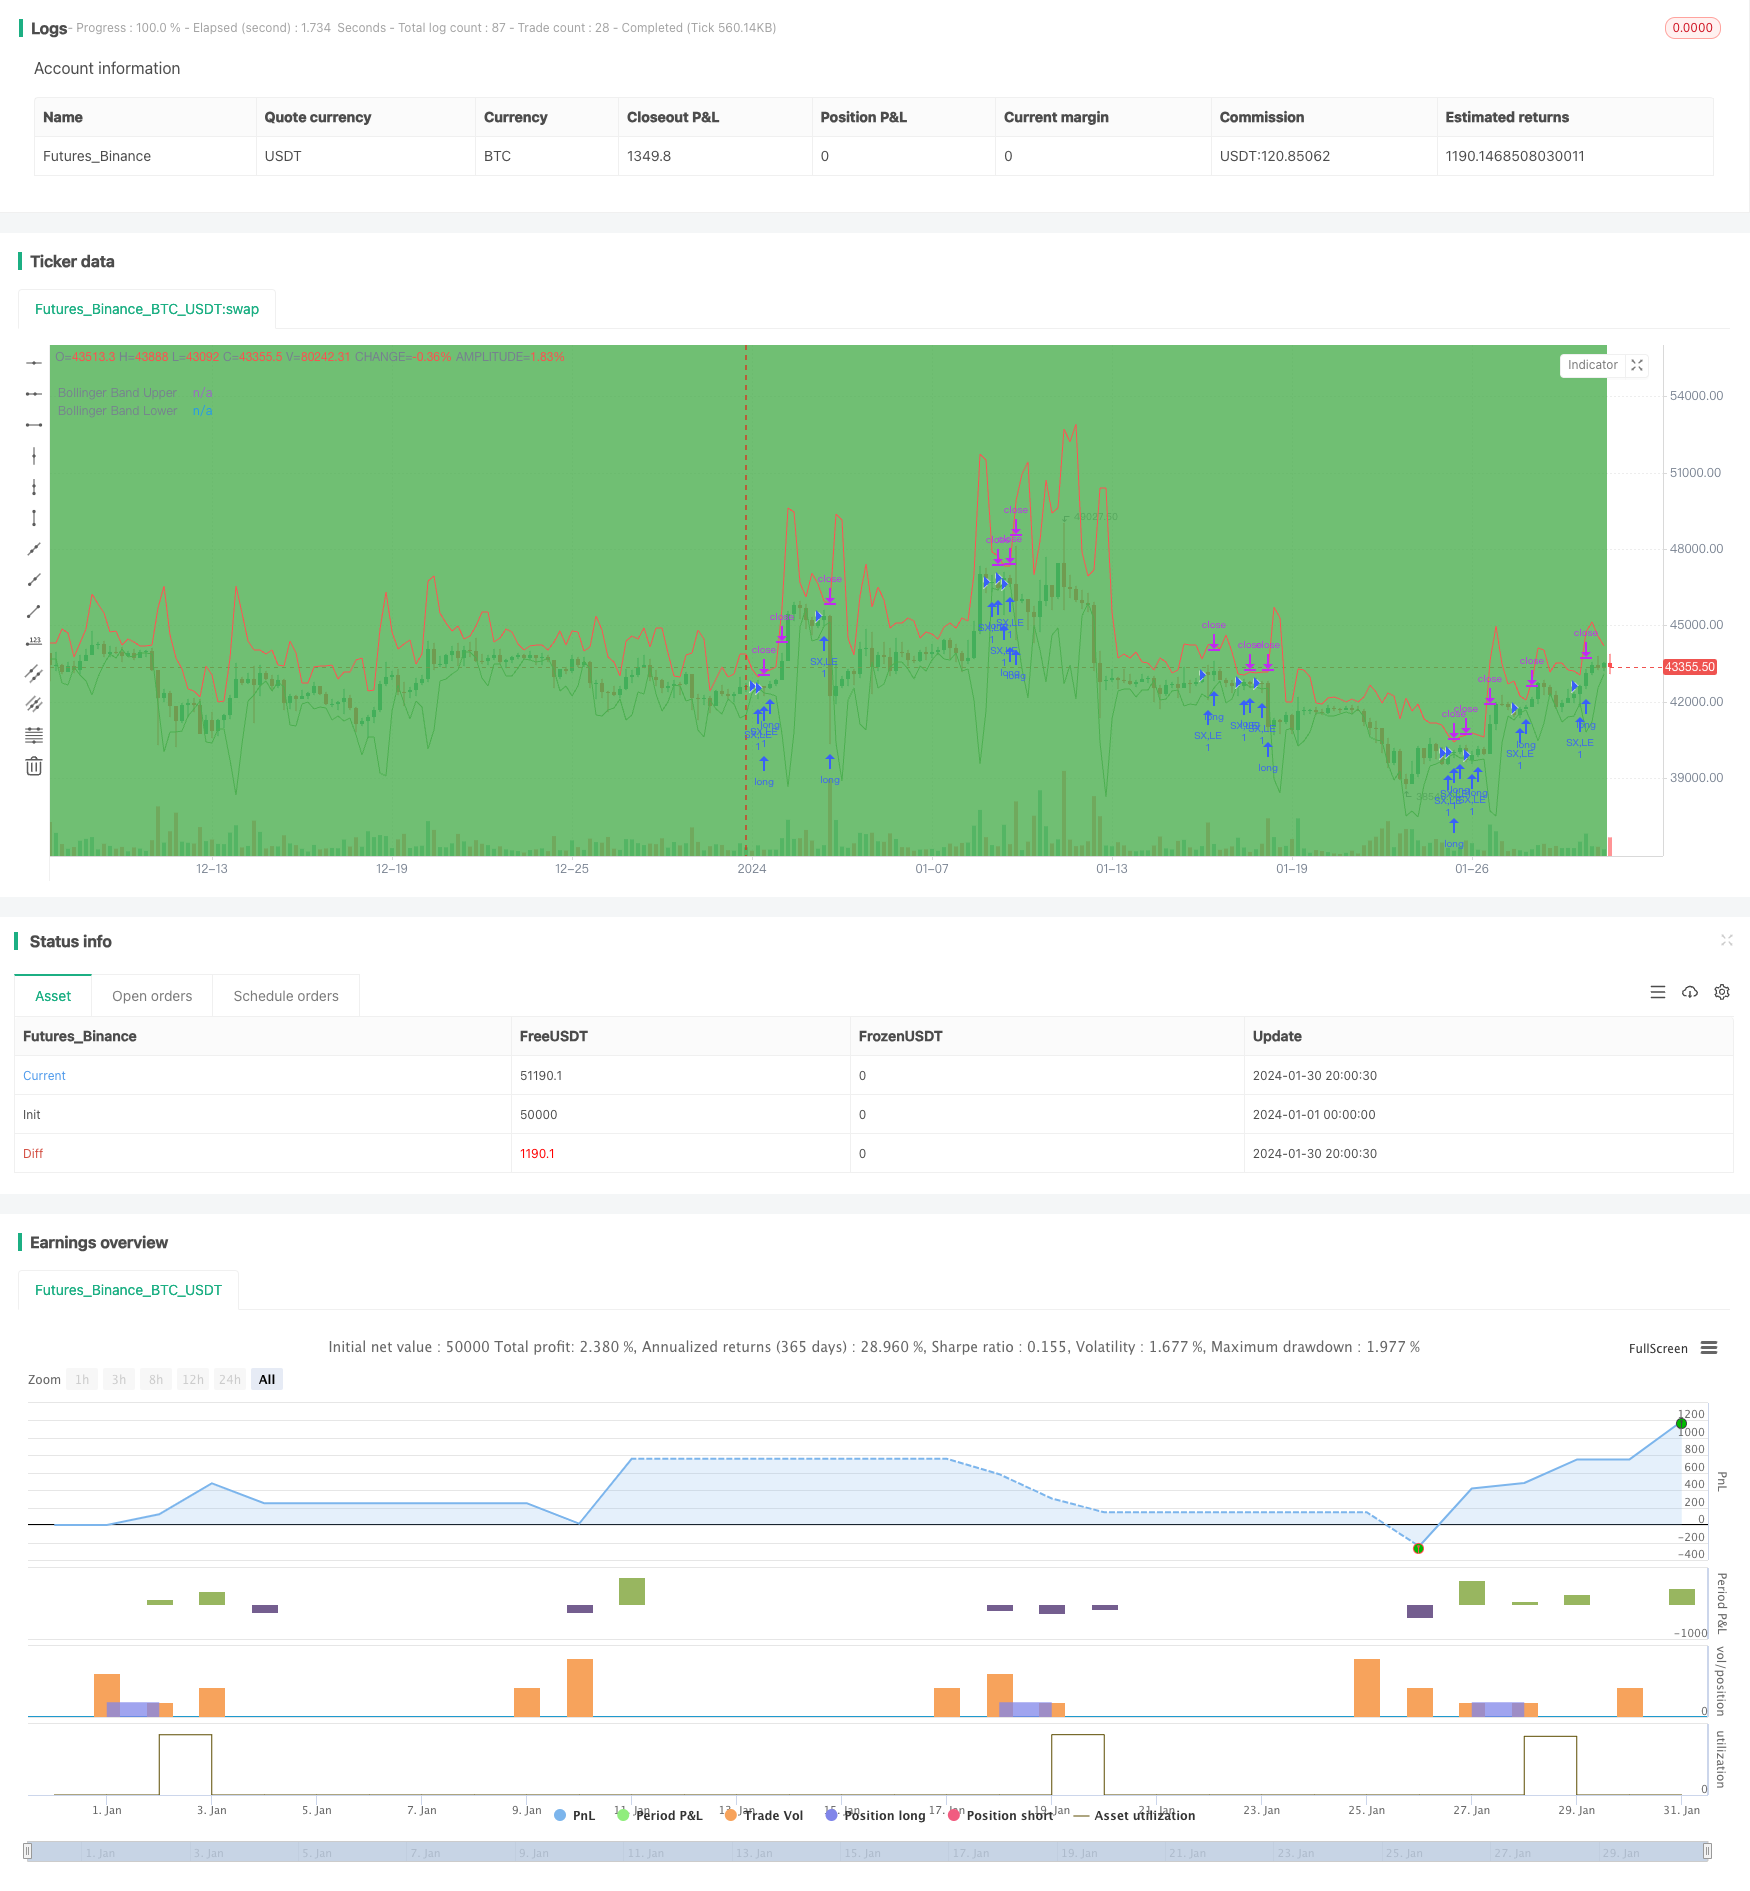
/*backtest
start: 2024-01-01 00:00:00
end: 2024-01-31 00:00:00
period: 5h
basePeriod: 15m
exchanges: [{"eid":"Futures_Binance","currency":"BTC_USDT"}]
*/

// This source code is subject to the terms of the Mozilla Public License 2.0 at https://mozilla.org/MPL/2.0/
// © abilash.s.90


dIMinusCalc(adxLen) =>

    smoothedTrueRange = 0.0
    smoothedDirectionalMovementMinus = 0.0
    dIMinus = 0.0
    trueRange = 0.0
    directionalMovementMinus = 0.0

    trueRange := max(max(high-low, abs(high-nz(close[1]))), abs(low-nz(close[1])))
    directionalMovementMinus := nz(low[1])-low > high-nz(high[1]) ? max(nz(low[1])-low, 0): 0

    smoothedTrueRange := nz(smoothedTrueRange[1]) - (nz(smoothedTrueRange[1])/adxLen) + trueRange
    smoothedDirectionalMovementMinus := nz(smoothedDirectionalMovementMinus[1]) - (nz(smoothedDirectionalMovementMinus[1])/adxLen) + directionalMovementMinus

    dIMinus := smoothedDirectionalMovementMinus / smoothedTrueRange * 100

    dIMinus

dIPlusCalc(adxLen) =>

    smoothedTrueRange = 0.0
    smoothedDirectionalMovementPlus = 0.0
    dIPlus =  0.0
    trueRange = 0.0
    directionalMovementPlus = 0.0

    trueRange := max(max(high-low, abs(high-nz(close[1]))), abs(low-nz(close[1])))
    directionalMovementPlus := high-nz(high[1]) > nz(low[1])-low ? max(high-nz(high[1]), 0): 0

    smoothedTrueRange := nz(smoothedTrueRange[1]) - (nz(smoothedTrueRange[1])/adxLen) + trueRange
    smoothedDirectionalMovementPlus := nz(smoothedDirectionalMovementPlus[1]) - (nz(smoothedDirectionalMovementPlus[1])/adxLen) + directionalMovementPlus

    dIPlus := smoothedDirectionalMovementPlus / smoothedTrueRange * 100

    dIPlus


Adx(adxLen) =>
    dIPlus =  0.0
    dIMinus = 0.0
    dX = 0.0
    aDX = 0.0
    dIPlus := dIPlusCalc(adxLen)
    dIMinus := dIMinusCalc(adxLen)
    dX := abs(dIPlus-dIMinus) / (dIPlus+dIMinus)*100
    aDX := sma(dX, adxLen)

    aDX

BarInSession(sess) => time(timeframe.period, sess) != 0


//@version=4
strategy("Bollinger Band + RSI + ADX + MACD", overlay=true)

//Session

session = input(title="Trading Session", type=input.session, defval="0930-1500")

sessionColor = BarInSession(session) ? color.green : na

bgcolor(color=sessionColor, transp=95)

// Bollinger Bands
src = input(high, title="Bollinger Band Source", type=input.source)
length = input(3, minval=1, type=input.integer, title="Bollinger Band Length")
mult = input(4.989, minval=0.001, maxval=50, step=0.001, type=input.float, title="Bollinger Band Std Dev")
basis = sma(src, length)
dev = mult * stdev(src, length)
upper = basis + dev
lower = basis - dev


plot(upper, title="Bollinger Band Upper", color=color.red)
plot(lower, title="Bollinger Band Lower", color=color.green)

// RSI
rsiSrc = input(close, title="RSI Source", type=input.source)
rsiLength = input(16, minval=1, type=input.integer, title="RSI Length")
rsiComparator = input(39.2, title="RSI Comparator", type=input.float, step=0.1)

rsi = rsi(rsiSrc, rsiLength)

// ADX
adxLength = input(14, minval=1, type=input.integer, title="ADX Length")
adxComparator = input(14, minval=1, type=input.integer, title="ADX Comparator")

adx = Adx(adxLength)

// Heikinashi

haClose = security(heikinashi(syminfo.ticker), timeframe.period, close)
haOpen = security(heikinashi(syminfo.ticker), timeframe.period, open)

nextHaOpen = (haOpen + haClose) / 2

//MACD

macdCalcTypeProcessed = input(title="MACD Source", type=input.source, defval=high)
fast = input(12, title="MACD Fast")
slow = input(20, title="MACD Slow")
signalLen = input(15, title="MACD Signal")

fastMA = ema(macdCalcTypeProcessed, fast)
slowMA = ema(macdCalcTypeProcessed, slow)
macd = fastMA - slowMA
signal = sma(macd, signalLen)


longCondition() =>
    (low < lower) and (rsi[0] > rsiComparator) and (adx > adxComparator) and (close > nextHaOpen) and BarInSession(session) and macd > signal

stop = (close - max((low - (low * 0.0022)), (close - (close * 0.0032)))) / syminfo.mintick
target = (max(upper, (close + (close * 0.0075))) - close) / syminfo.mintick


strategy.entry("SX,LE", strategy.long, when=longCondition(), comment="SX,LE")
strategy.close_all(when=(not BarInSession(session)))
strategy.exit("LX", from_entry="SX,LE", profit=target, loss=stop)