Overview
The Dual Breakthrough Moving Average Trading Strategy is a strategy that generates buy and sell signals based on multiple indicators. It integrates moving averages, support/resistance indicators, trend indicators and overbought/oversold indicators to form a comprehensive trading system.
Strategy Logic
Buy Signal Logic
The buy signal requires the following four conditions to be true at the same time:
- Close price above Parabolic SAR indicator
- Close price above Simple Moving Average with length = 200
- MACD indicator’s MACD line above 0
- RSI indicator with length = 7 above 50
Once all four conditions are met, a buy signal of 1 is generated.
Sell Signal Logic
The sell signal logic is exactly the opposite of the buy signal. It requires the following four conditions:
- Close price below Parabolic SAR indicator
- Close price below Simple Moving Average with length = 200
- MACD indicator’s MACD line below 0
- RSI indicator with length = 7 below 50
When all four conditions are true at the same time, a sell signal of -1 is generated.
Entry and Exit
The entry conditions depend on the buy and sell signals. To go long, the buy signal must equal 1. To go short, the sell signal must equal -1.
There are two exit conditions. One is a fast exit once the signal changes. The other is to wait for the opposite signal before exiting a position. For example, wait for a sell signal after going long.
Advantage Analysis
The biggest advantage of the Dual Breakthrough Moving Average Strategy is the combination of multiple indicators, which enables comprehensive judgment of trends, overbought/oversold status, etc. Specifically, the main advantages are:
- Parabolic SAR judges effective breakthroughs as support/resistance;
- Moving averages determine overall trend direction, avoiding counter-trend operations;
- MACD clearly judges bullish/bearish status;
- RSI avoids overbought/oversold risks;
- Combining multiple indicators greatly improves stability and success rate.
In general, this system is very suitable for self-learning by beginners, as well as for use by professionals.
Risk Analysis
Although the strategy has many advantages, there are still some risks to watch out for:
- Parameter optimization may lead to overfitting and poor live performance;
- High probability of indicator divergence, requiring reconfirmation before entries;
- Stop loss strategy not perfect, prone to being trapped in positions;
- Potentially excessive trading frequency, increasing costs and slippage.
To address these risks, the following measures could be adopted:
- Add filters to ensure consistent signals;
- Strict stop loss to control single trade loss;
- Control number of trades and trade frequency;
- Test parameter combinations to prevent overfitting.
Optimization Directions
There is still great potential to optimize this strategy further:
- Add machine learning models to predict signal strength;
- Incorporate text analysis to judge impact of significant news events;
- Add market structure indicators and adjust strategy by period;
- Optimize stop loss methods, such as trailing stop loss or shock stop loss;
- Parameters tuning and combination to find optimum pairs.
With improvements in the above aspects, the strategy’s performance can be further enhanced for live trading applications.
Conclusion
The Dual Breakthrough Moving Average Trading Strategy is a versatile strategy combining multiple indicators. It incorporates trend, support/resistance, overbought/oversold indicators to determine entries and exits. With complementary effects and comprehensive judgments, the strategy provides an Outstanding idea model for quantitative trading that is worth in-depth research and application.
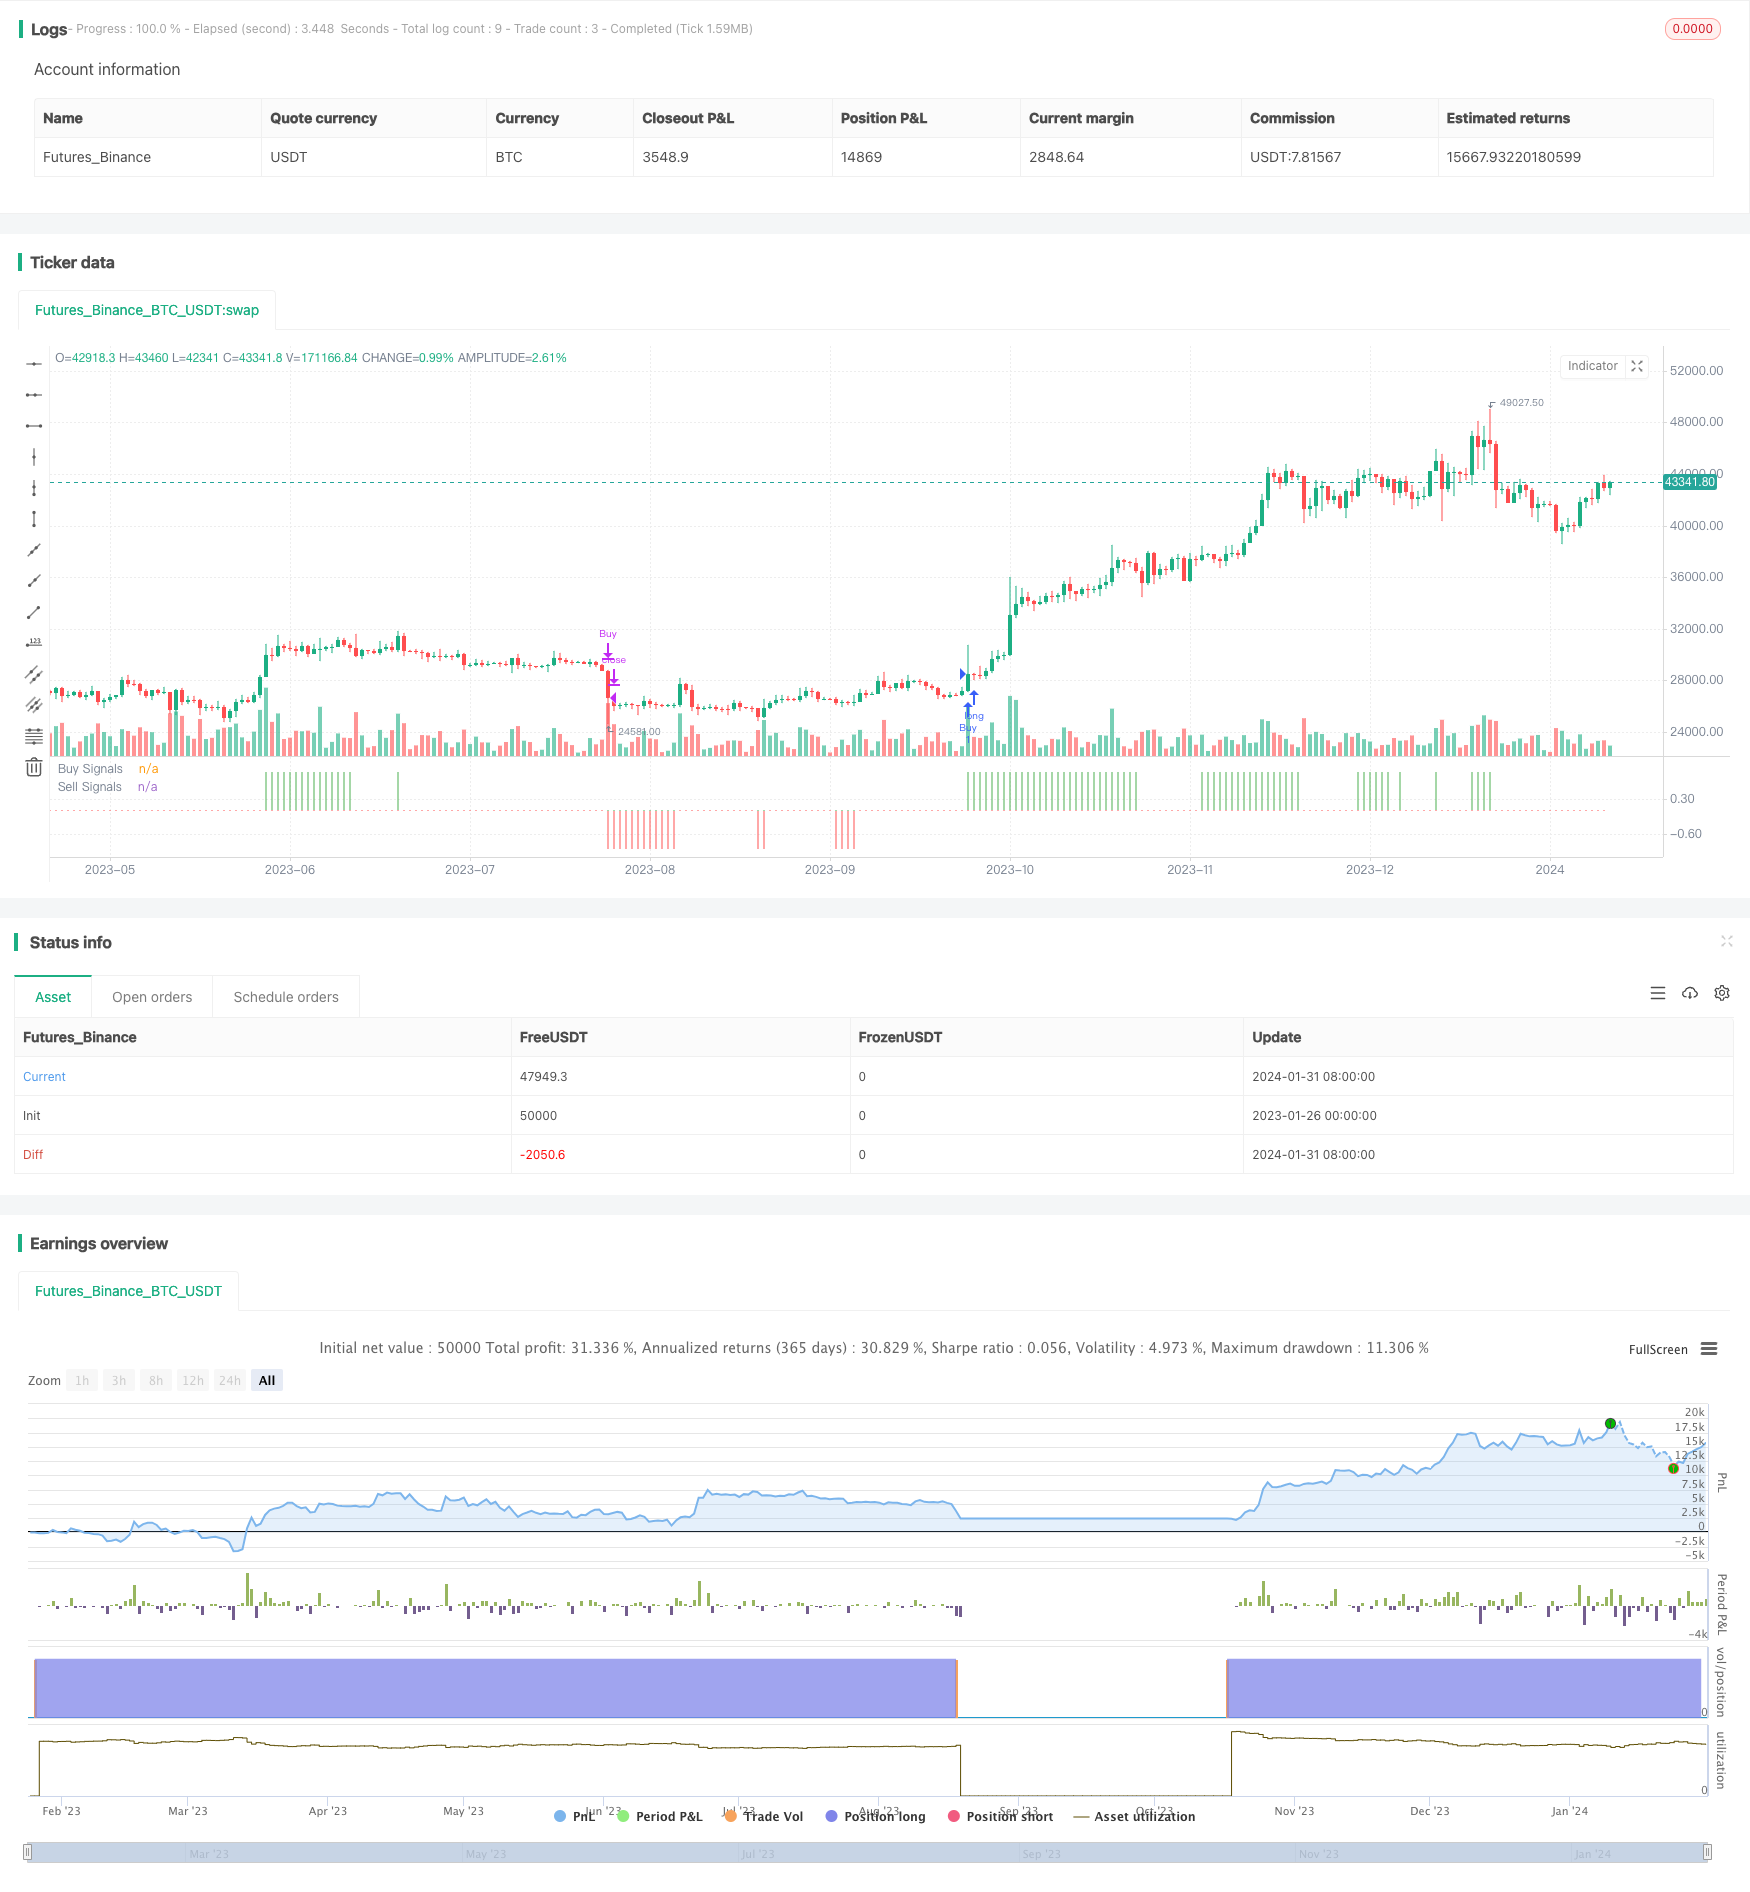
/*backtest
start: 2023-01-26 00:00:00
end: 2024-02-01 00:00:00
period: 1d
basePeriod: 1h
exchanges: [{"eid":"Futures_Binance","currency":"BTC_USDT"}]
*/

//@version=4
//Original Indicator by @Shizaru - simply made into a strategy!

strategy("Simple Buy/Sell Strategy", overlay=false)
psar = sar(0.02,0.02,0.2)
c1a = close > psar
c1v = close < psar

malen = input(200, title="MA Length")
mm200 = sma(close, malen)
c2a = close > mm200
c2v = close < mm200

fast = input(12, title="Fast EMA Length")
slow = input(26, title="Slow EMA Length")
[macd,signal,hist] = macd(close, fast,slow, 9)
c3a = macd >= 0
c3v = macd <= 0

rsilen = input(7, title="RSI Length")
th = input(50, title="RSI Threshold")
rsi14 = rsi(close, rsilen)
c4a = rsi14 >= th
c4v = rsi14 <= th

buy = c1a and c2a and c3a and c4a ? 1 : 0
sell = c1v and c2v and c3v and c4v ? -1 : 0

longtrades = input(true, title="Long Trades")
shorttrades = input(false, title="Short Trades")
quickexit = input(false, title="Quick Exits")

strategy.entry("Buy", strategy.long, when=buy==1 and longtrades==true)
strategy.close("Buy", when=quickexit==true ? buy==0 : sell==-1)
strategy.entry("Sell", strategy.short, when=sell==-1 and shorttrades==true)
strategy.close("Sell", when=quickexit==true ? sell==0 : buy==1)

plot(buy, style=plot.style_histogram, color=color.green, linewidth=3, title="Buy Signals")
plot(sell, style=plot.style_histogram, color=color.red, linewidth=3, title="Sell Signals")