Overview
The Trend Prediction Dual Moving Average Strategy is a strategy that tries to predict trend changes before the actual break from one trend to another. It extends LazyBear’s WaveTrend indicator. The strategy can identify price trends and display buy and sell signals through curve filling visual effects.
Strategy Principle
The strategy uses LazyBear’s WaveTrend indicator as the basis. WaveTrend itself is an excellent trend tracking indicator. The strategy extends and optimizes on this basis. The main steps are as follows:
- Calculate average HLC price
- Calculate EMA average price
- Calculate EMA of absolute deviation of price
- Calculate zero-leveled adjusted indicator
- Calculate EMA of trend
- Calculate fast and slow moving averages
Through such processing, random price fluctuations can be filtered out and relatively clear trends can be identified. The cross of fast and slow moving averages can be used to issue buy and sell signals.
Advantage Analysis
The strategy has the following advantages:
- Can effectively identify price trends
- Timely signal generation, can predict trend reversals in advance
- Clearly visualize trends through curve filling
- Large parameter optimization space that can be adjusted according to different varieties and cycles
Risk Analysis
The strategy also has some risks:
- Like all technical indicator strategies, there is a risk of failure in case of extreme price volatility
- Improper parameter settings may cause false signals
- Signal lag may result in losses
These risks can be mitigated through methods like adjusting parameters, combining other indicators, etc.
Optimization Directions
The strategy can be optimized in the following aspects:
- Adjust parameters to suit more varieties and cycles
- Increase stop loss strategy to control loss risk
- Combine with other indicators to improve signal accuracy
- Increase machine learning models to assist in judging trends and issuing signals
Summary
Overall, the Trend Prediction Dual Moving Average Strategy is a very promising strategy. It can effectively identify price trends and try to predict trend changes in advance. With some optimization and improvement, the strategy can become a powerful quantitative trading system. Its simple and straightforward trading logic and clear visual effects also make it a strategy worth learning and researching.
/*backtest
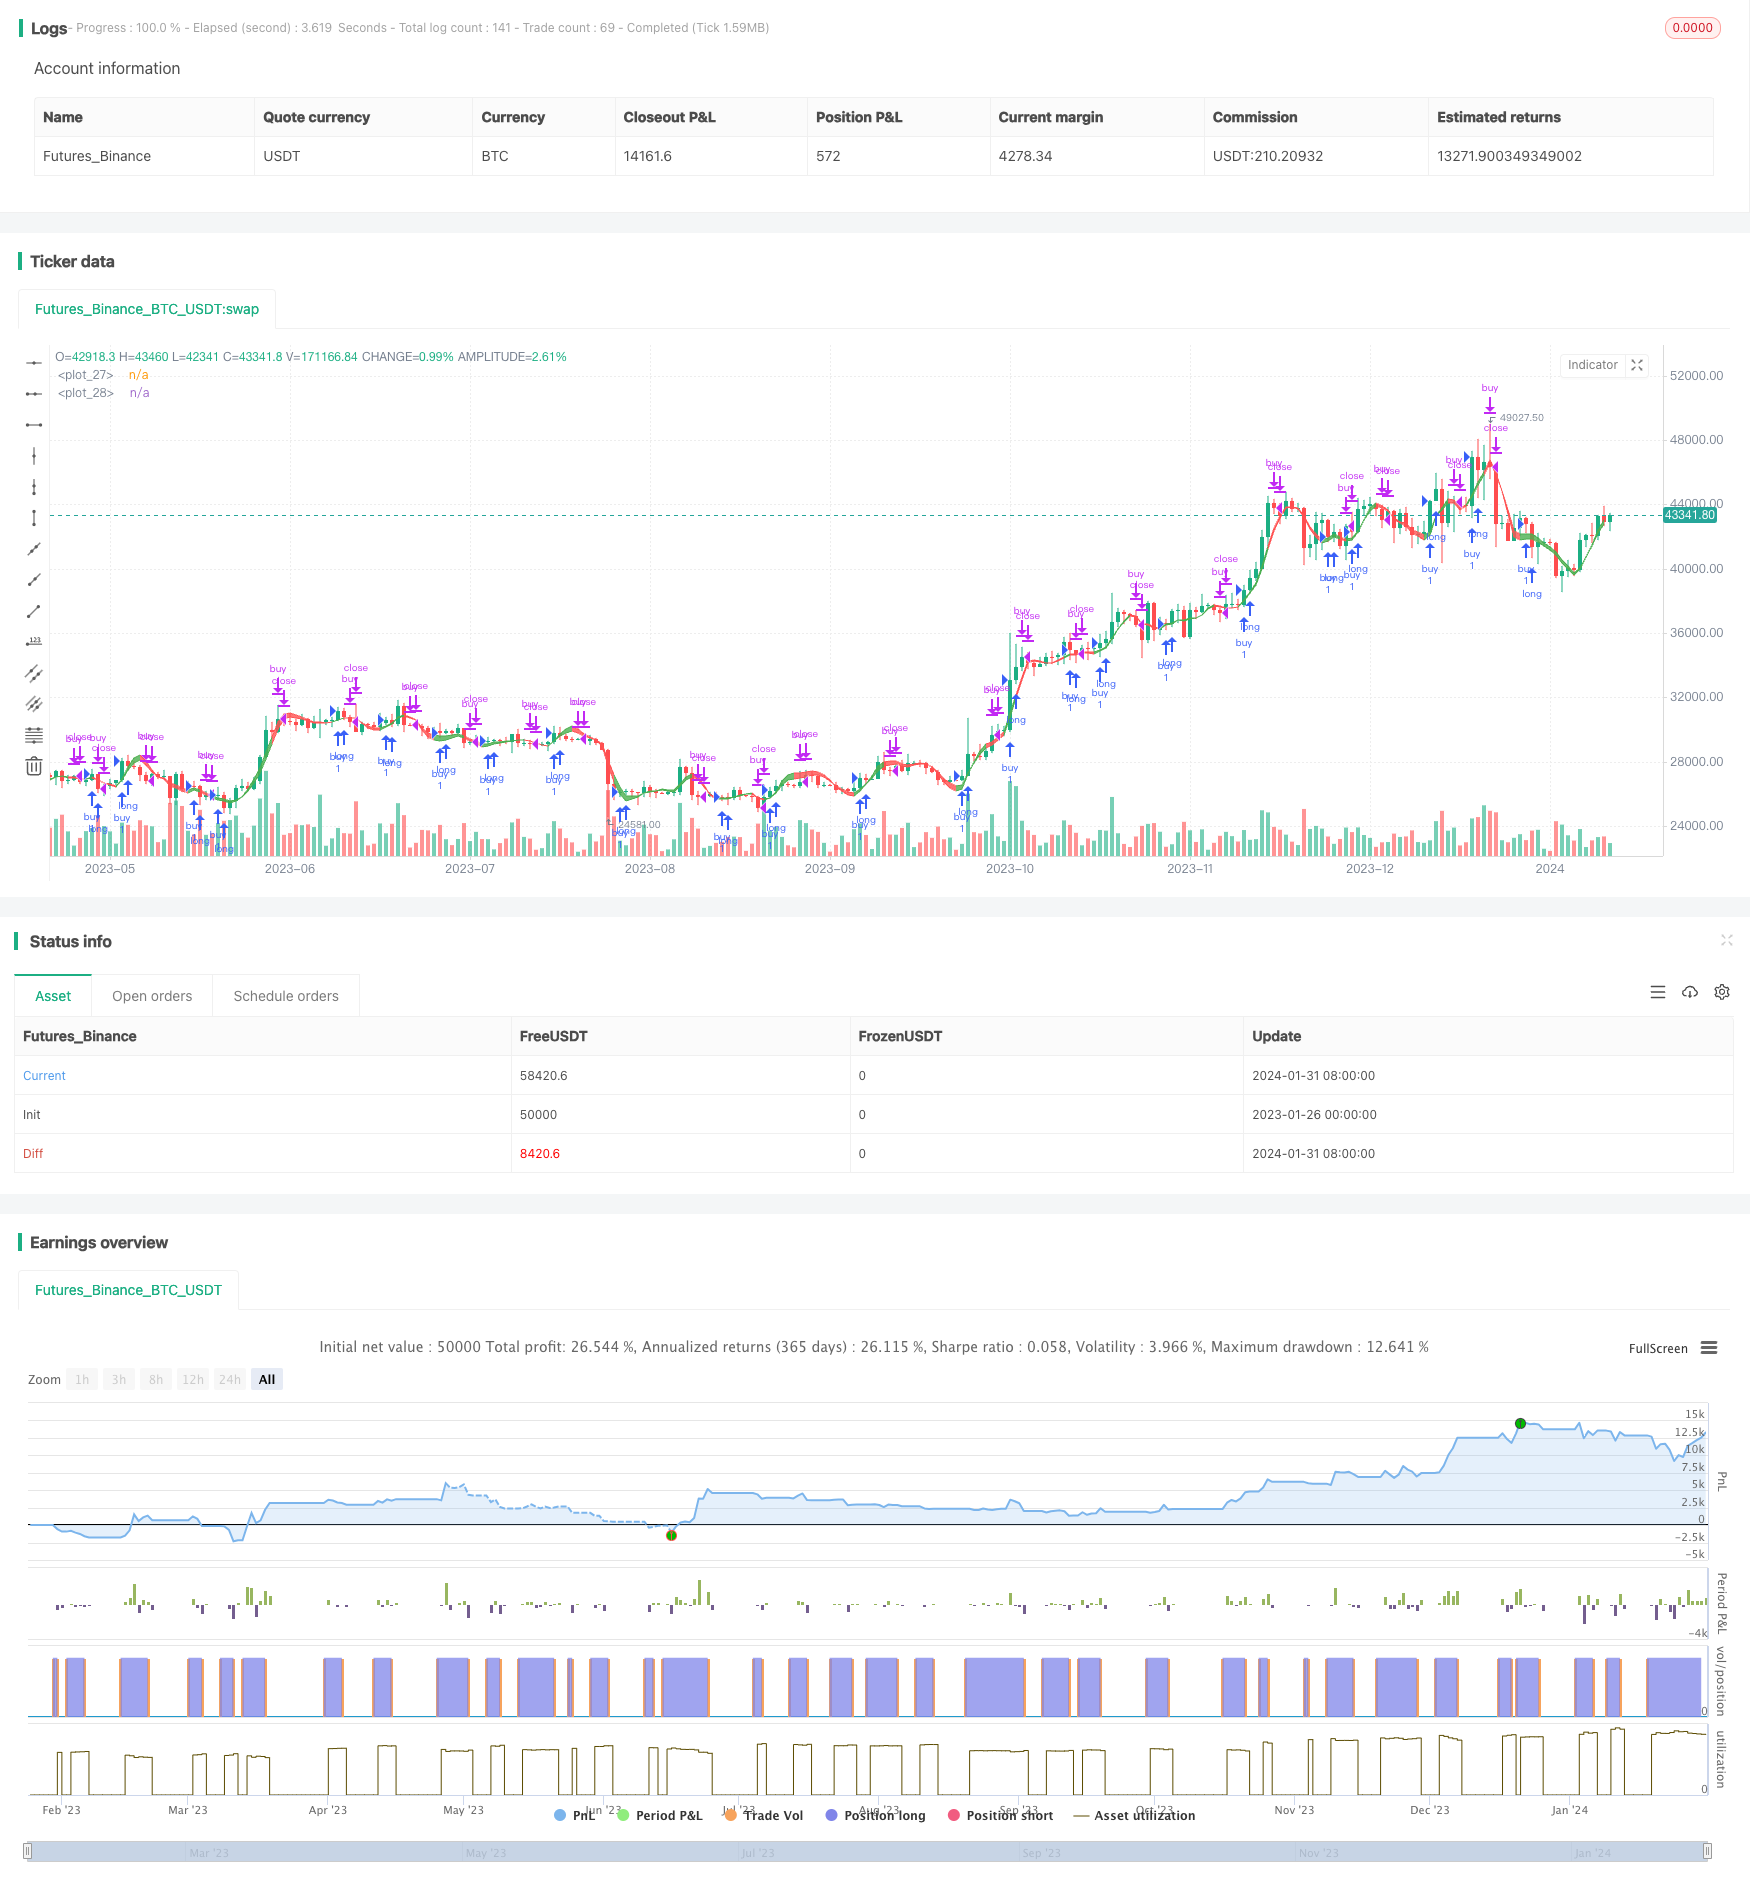
start: 2023-01-26 00:00:00
end: 2024-02-01 00:00:00
period: 1d
basePeriod: 1h
exchanges: [{"eid":"Futures_Binance","currency":"BTC_USDT"}]
*/
//@version=4
strategy("BreakingDawn [JackTz]", overlay = true)
// WaveTrend [LazyBear]
// ░░░░░░░░░░░░░░░░░░░░░░░░░░░░░░░░░░░░░░░░░░░░░░░░░░░░░░░░░░░░░░░░░░░░░░░░░░░░░░░░░░░░░░░░░░░░░░░░░░░░░░░░░░░░░░░░░░░░░░░░░░░░░░░░░░░░░░░░░░░░░░░░░░
n1 = input(10, "Channel Length")
n2 = input(21, "Average Length")
WTfactor = input(4, title=" WTFactor")
averageHlc3 = sum(hlc3, WTfactor) / WTfactor
ap = averageHlc3
esa = ema(ap, n1)
d = ema(abs(ap - esa), n1)
ci = (ap - esa) / (0.015 * d)
tci = ema(ci, n2)
wt1 = tci
wt2 = sma(wt1,4)
wtAvg = wt1-wt2
wtPeriodAvgVal = wtAvg * 45 + averageHlc3
wtPeriodAvg2Val = wtAvg * 25 + averageHlc3
buy = wtAvg[1] < wtAvg and wtAvg < close
sell = wtAvg[1] > wtAvg
fillColor = buy ? color.green : color.red
control = plot(wtPeriodAvgVal, color = fillColor)
signal = plot(wtPeriodAvg2Val, color = fillColor)
fill(signal, control, color = fillColor)
if year > 2016
strategy.entry("buy", strategy.long, when = buy)
strategy.close("buy",when = sell)