Renko and Relative Vigor Index Trend Following Strategy

Overview
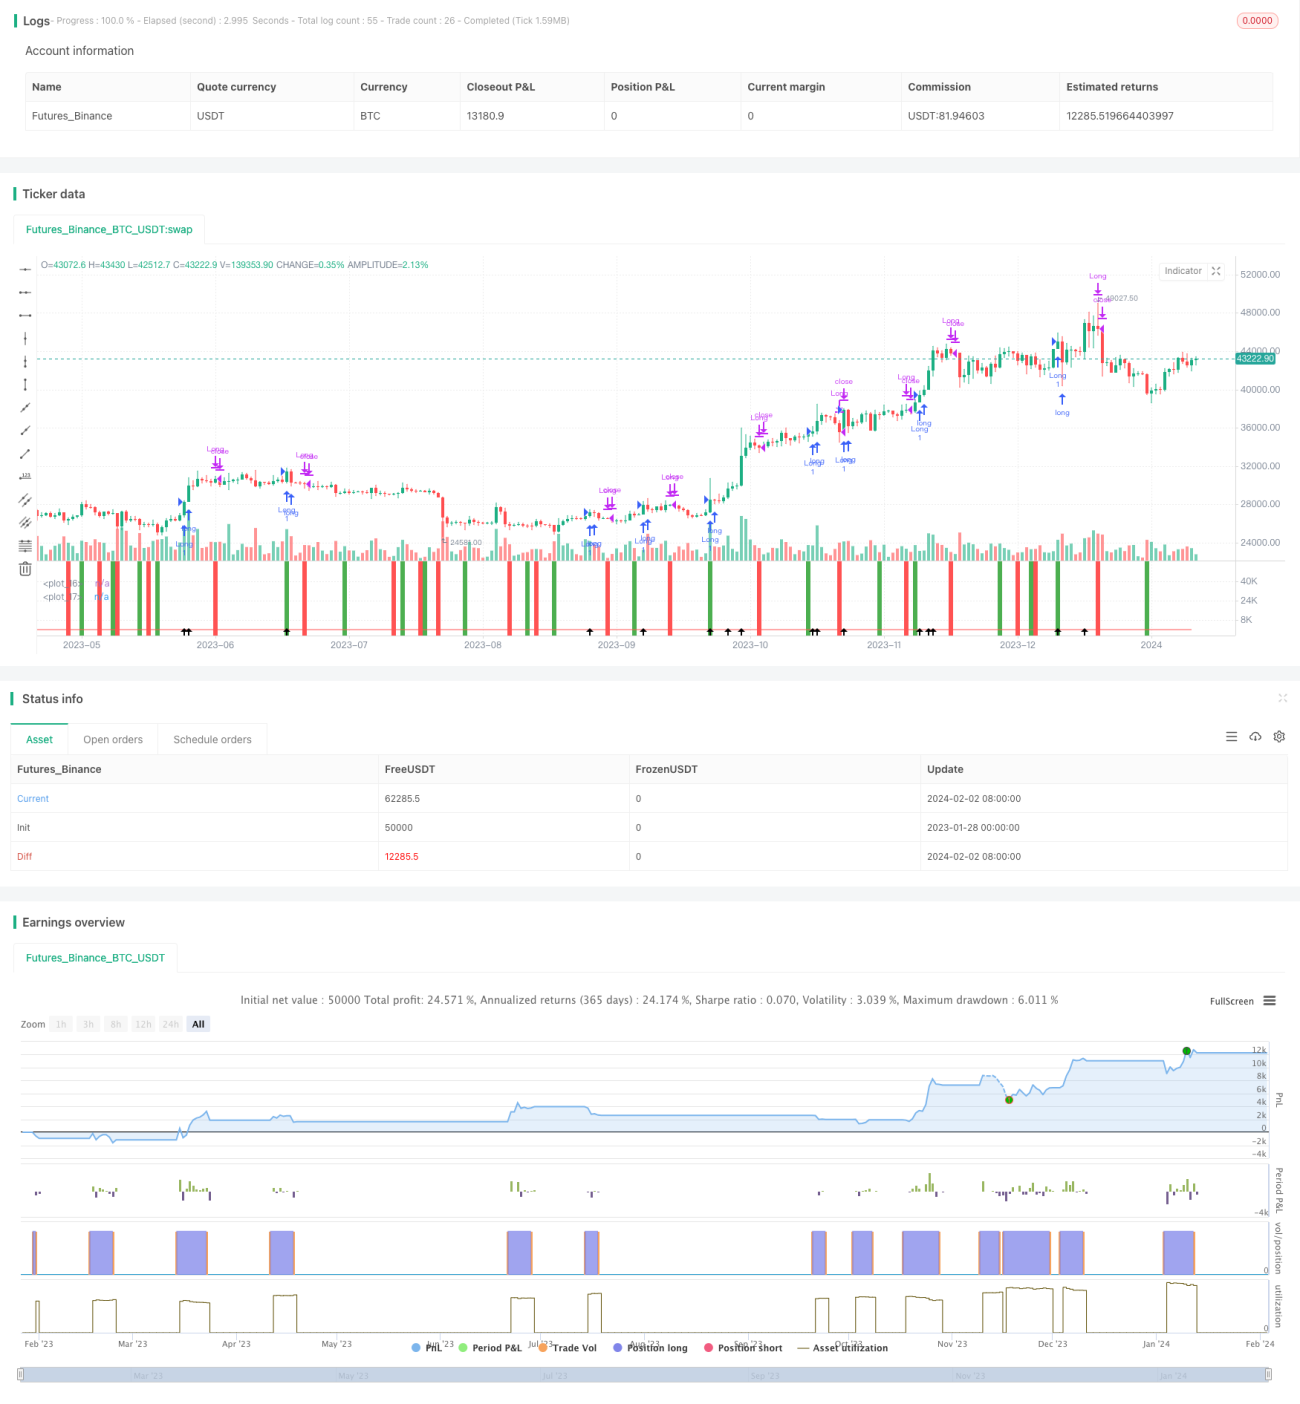
This strategy combines the Renko charts and Relative Vigor Index (RVI) to capture most of the major market trends. It works well on major symbols like BTCUSD, HSI etc.
Strategy Logic
The strategy constructs Renko bricks based on 9 period ATR. A new green brick is constructed when close price exceeds the previous brick's high. A new red brick is constructed when close price falls below the previous brick's low. The trend direction is determined by RVI indicator.
RVI oscillates between 0-1 to measure the relative strength between buying and selling pressure. Above 0.5 represents stronger buying pressure while below 0.5 represents stronger selling pressure. RVI crossing above its smooth moving average gives buy signal as selling pressure eases. RVI crossing below gives sell signal as buying pressure eases.
Combine the Renko brick direction and RVI signals to enter long or short positions accordingly.
Advantages
- Renko bricks filter out normal market noise and only react to significant price movement, avoiding whipsaws.
- RVI helps identifying trend reversal, further confirming trading signals.
- Combining two indicators filters out some noise and enables capturing major trends.
Risks
- Brick size directly affects trading frequency. Bricks too large may miss opportunity while too small increases costs.
- Improper RVI parameters may cause missing signals or more false signals.
- Double filtering misses some trading opportunity.
Enhancement
- Dynamic brick size to adapt changing volatility.
- Optimize RVI parameters to find best balance.
- Test stability across different symbols and timeframes.
Conclusion
This strategy combines two different types of indicators to capture major trends. Further optimization on Renko and RVI parameters can improve stability. No model is perfect and missing some trades is inevitable. Users need to assess their own risk preference and choose proper symbol/parameter combo.
- 1