Overview
This article introduces a momentum reversal tracking strategy based on the Parabolic Stop and Reverse (SAR) indicator. This strategy utilizes the Parabolic SAR indicator to identify potential trend reversals in the Nifty Futures market for automated trend tracking trading.
The strategy is mainly suitable for traders who prefer a systematic trading approach, providing clear entry and exit signals. By capturing market trends, it helps traders achieve their financial goals.
Strategy Logic
The strategy uses the Parabolic SAR indicator to determine the price trend direction. In an uptrend, the SAR value is below the price and gradually moves up as new highs occur; In a downtrend, the SAR value is above the price and gradually moves down as new lows occur.
When the SAR value crosses above or below the price, it indicates a potential trend reversal and the strategy will take corresponding short or long positions to capture the new trend direction.
Specifically, after initially calculating the current SAR value and acceleration factor, the strategy keeps tracking new highs/lows and adjusts the SAR value accordingly. On a confirmed bar, if in an uptrend, it takes a short position below the SAR value; if in a downtrend, it takes a long position above the SAR value.
Advantage Analysis
- Captures market reversals using the classic Parabolic SAR indicator
- Provides clear systematical entry and exit signals
- Helps tracking trends and capturing additional price movement
- Automated trading system without manual decision-making
Risk Analysis
- SAR indicator signals may not be 100% reliable, false signals could occur
- Failed reversals can cause stop loss
- Impact of contract expiry needs consideration
- Trading costs impact on strategy profitability
Optimization Directions
- Optimize SAR parameters (step, initial value, maximum value, etc.)
- Combine other reversal indicators (RSI, MACD etc.) to confirm reversals
- Add condition logics (volume etc.) to filter false signals
- Consider using trailing stops instead of fixed stops
- Consider auto-adjusting position sizing
Conclusion
The strategy provides an automated system to capture market trend reversals using the Parabolic SAR indicator. It gives clear entry and exit signals for trading decisions, helping profit from trend tracking. But issues like false signals, stop loss risks also need attention. With continuous optimization, it has the potential to become a reliable trend tracking method.
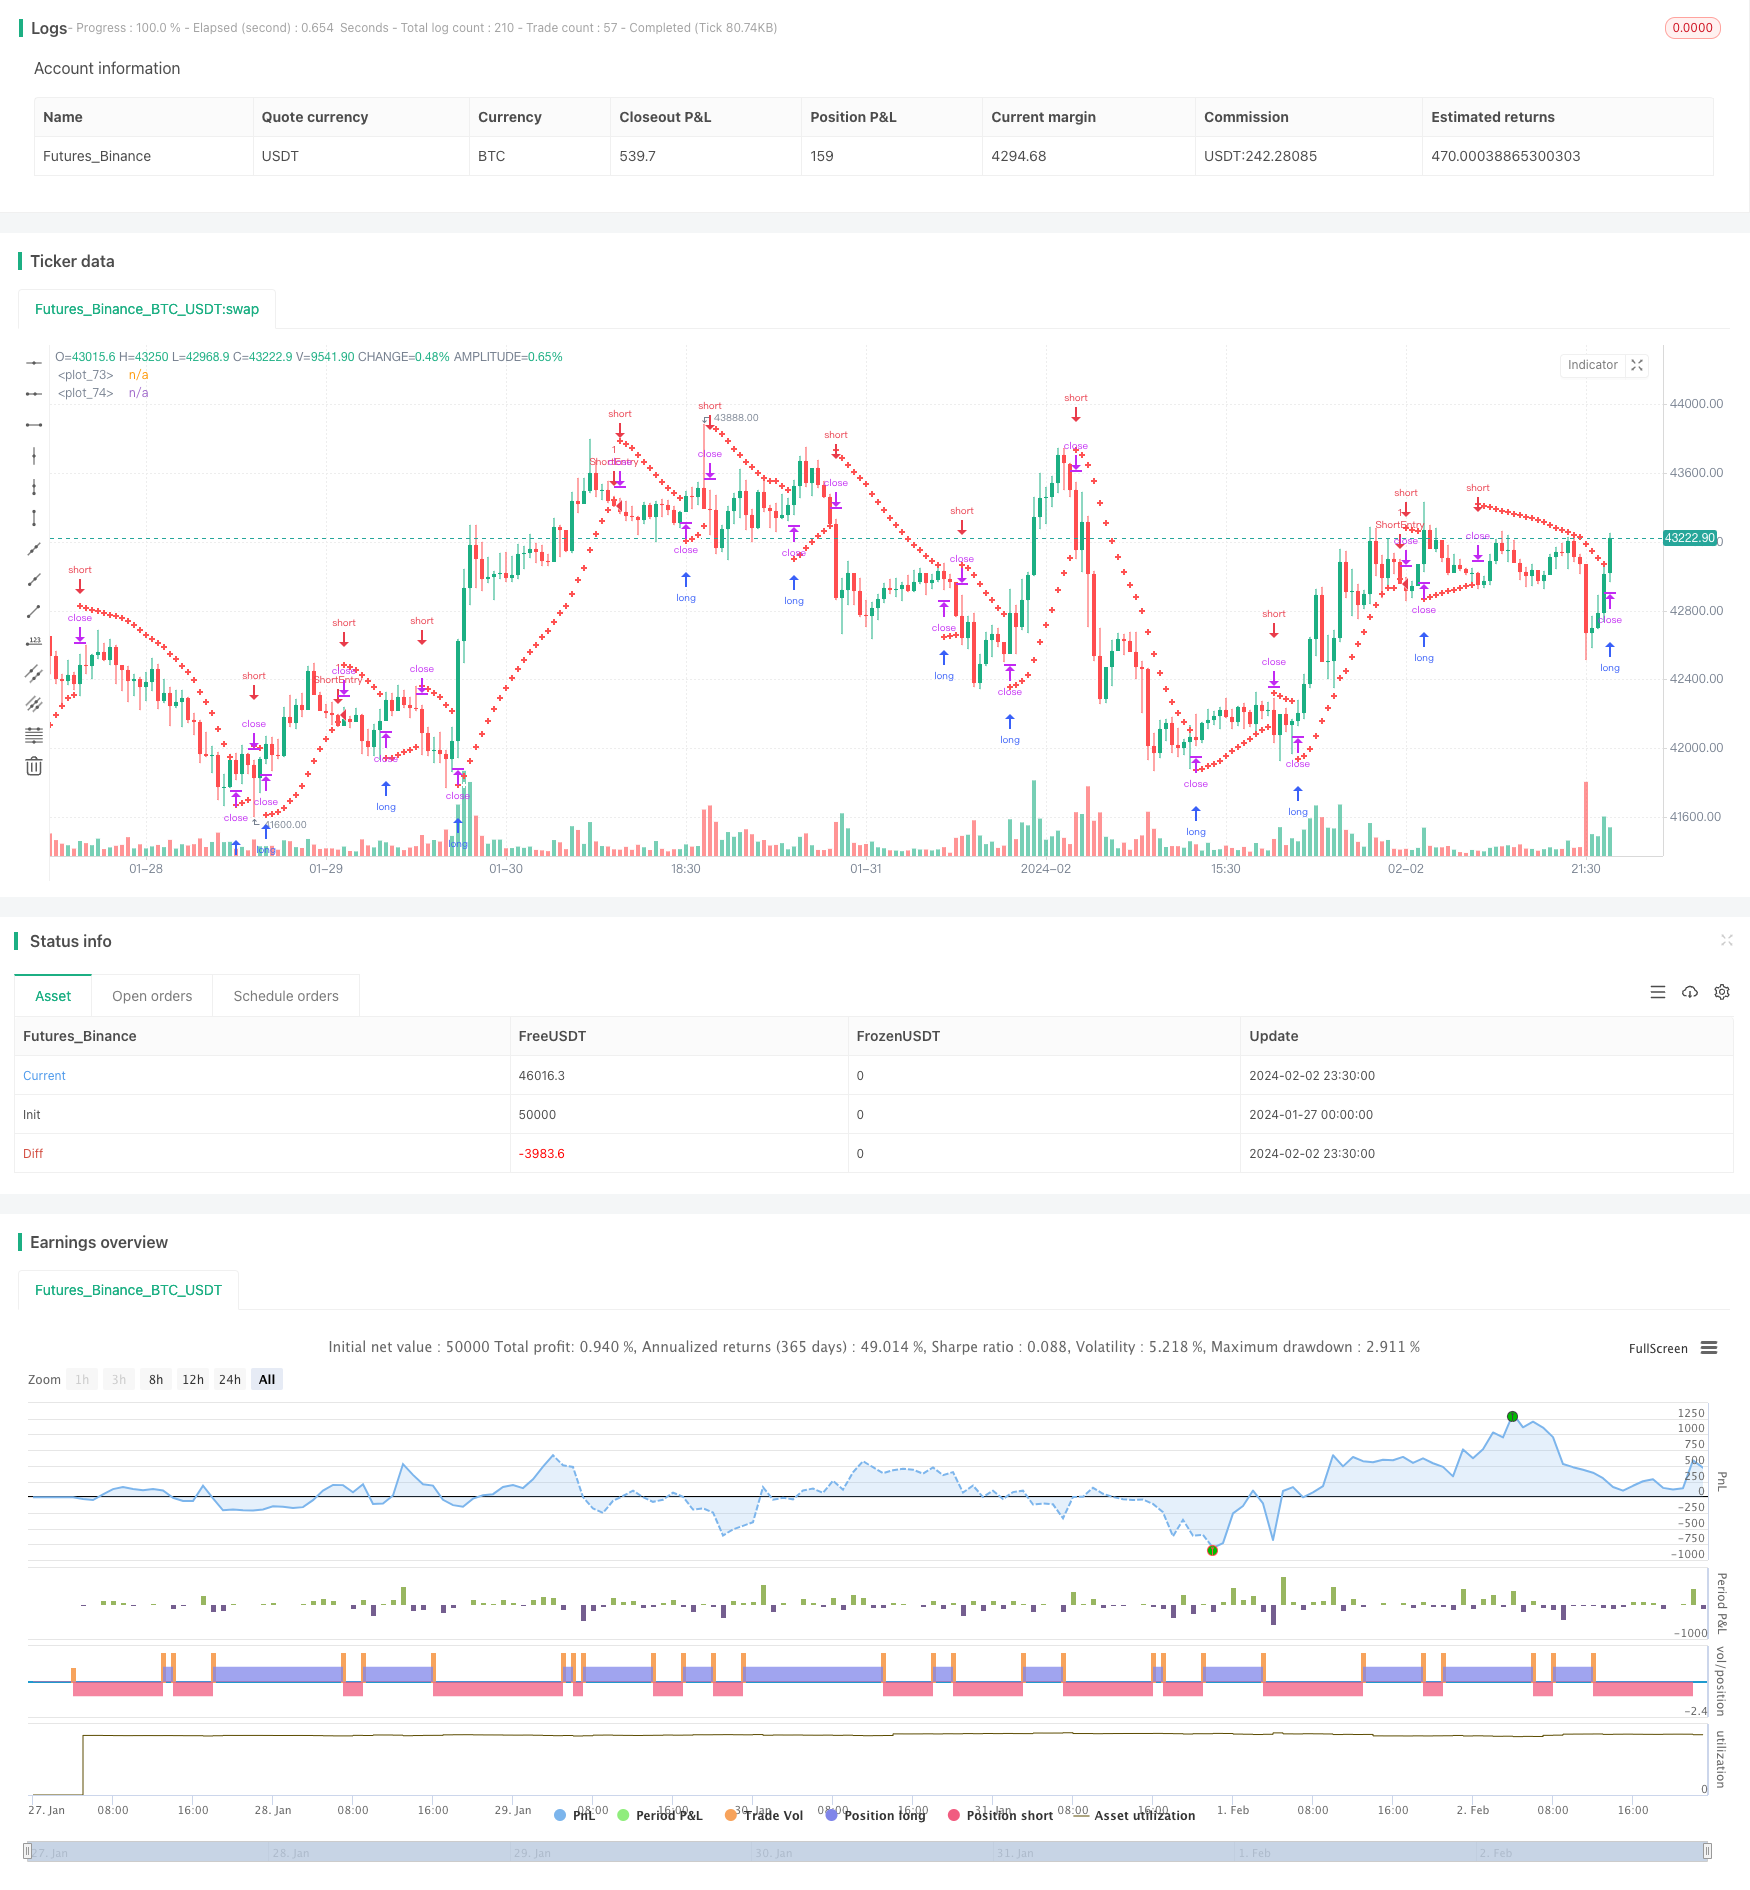
/*backtest
start: 2024-01-27 00:00:00
end: 2024-02-03 00:00:00
period: 30m
basePeriod: 15m
exchanges: [{"eid":"Futures_Binance","currency":"BTC_USDT"}]
*/

//@version=5
strategy("Positional Parabolic SAR Strategy", overlay=true)
initial = input(0.02)
step = input(0.02)
cap = input(0.2)
var bool isUptrend = na
var float Extremum = na
var float SARValue = na
var float Accelerator = initial
var float futureSAR = na

if bar_index > 0
    isNewTrendBar = false
    SARValue := futureSAR
    if bar_index == 1
        float pastSAR = na
        float pastExtremum = na
        previousLow = low[1]
        previousHigh = high[1]
        currentClose = close
        pastClose = close[1]
        if currentClose > pastClose
            isUptrend := true
            Extremum := high
            pastSAR := previousLow
            pastExtremum := high
        else
            isUptrend := false
            Extremum := low
            pastSAR := previousHigh
            pastExtremum := low
        isNewTrendBar := true
        SARValue := pastSAR + initial * (pastExtremum - pastSAR)
    if isUptrend
        if SARValue > low
            isNewTrendBar := true
            isUptrend := false
            SARValue := math.max(Extremum, high)
            Extremum := low
            Accelerator := initial
    else
        if SARValue < high
            isNewTrendBar := true
            isUptrend := true
            SARValue := math.min(Extremum, low)
            Extremum := high
            Accelerator := initial
    if not isNewTrendBar
        if isUptrend
            if high > Extremum
                Extremum := high
                Accelerator := math.min(Accelerator + step, cap)
        else
            if low < Extremum
                Extremum := low
                Accelerator := math.min(Accelerator + step, cap)
    if isUptrend
        SARValue := math.min(SARValue, low[1])
        if bar_index > 1
            SARValue := math.min(SARValue, low[2])
    else
        SARValue := math.max(SARValue, high[1])
        if bar_index > 1
            SARValue := math.max(SARValue, high[2])
    futureSAR := SARValue + Accelerator * (Extremum - SARValue)
    if barstate.isconfirmed
        if isUptrend
            strategy.entry("ShortEntry", strategy.short, stop=futureSAR, comment="ShortEntry")
            strategy.cancel("LongEntry")
        else
            strategy.entry("LongEntry", strategy.long, stop=futureSAR, comment="LongEntry")
            strategy.cancel("ShortEntry")
plot(SARValue, style=plot.style_cross, linewidth=3, color=color.white)
plot(futureSAR, style=plot.style_cross, linewidth=3, color=color.red)