ADX-Filtered SuperTrend Pivot Trading Strategy

Overview
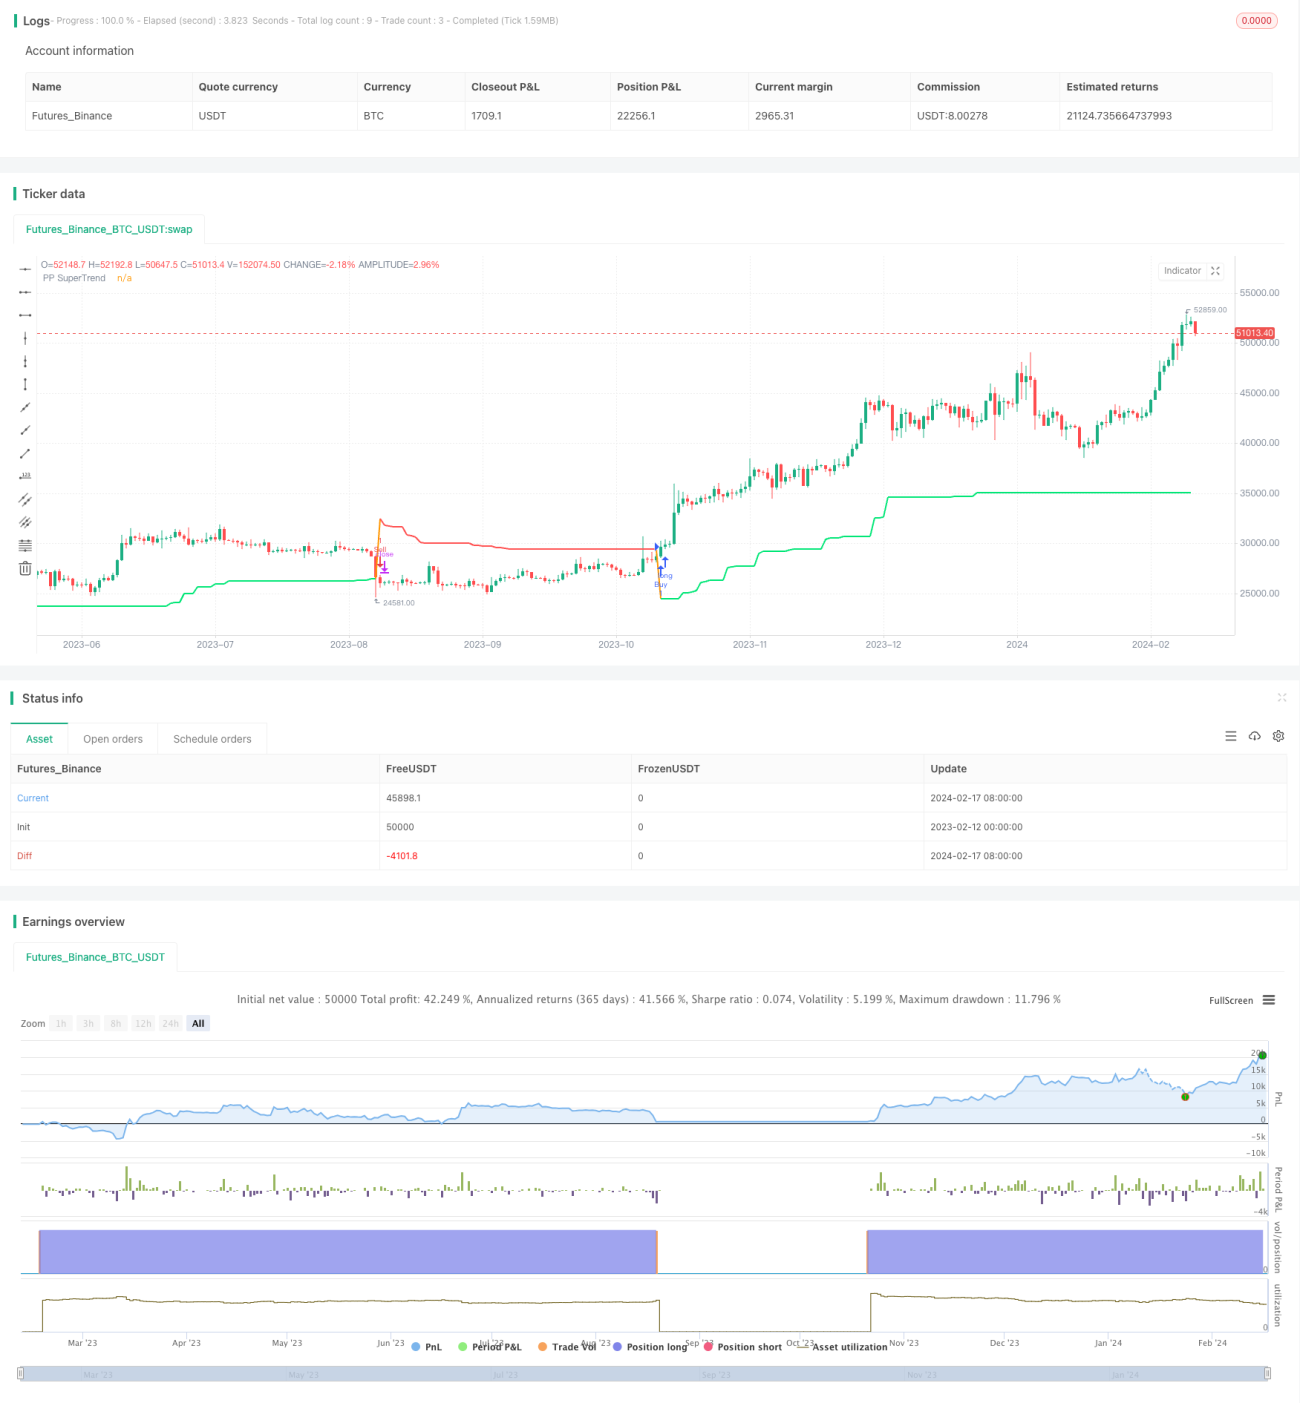
This strategy combines SuperTrend pivot points and the ADX indicator for high-frequency trading. The SuperTrend lines dynamically calculate the latest support and resistance levels to determine price trends and generate trading signals. The ADX indicator measures trend strength and acts as a filter, only taking trades when the trend is strong enough.
Strategy Logic
-
Calculate pivot support and resistance lines. Take the closing price and add/subtract an ATR range above and below. Breaks of these lines signal trend reversions.
-
ADX determines trend strength. High ADX values indicate a strong trend.
-
Combine both for trade signals. Go long/short only on pivot breaks and high ADX.
Advantage Analysis
Advantages of this strategy:
-
Dynamic SuperTrend lines quickly identify breakouts.
-
ADX filter avoids false signals during range-bound markets.
-
Good risk-reward ratio and drawdown control.
Risk Analysis
Risks of this strategy:
-
Gap moves can invalidate SuperTrend lines.
-
Poor ADX threshold setting impacts performance.
-
High trading frequency increases transaction costs.
Solutions:
-
Optimize parameters to allow wider breakout ranges.
-
Test for better ADX values.
-
Reduce trade frequency.
Optimization Directions
Areas for improvement:
-
Optimize ATR multiplier for more robust lines.
-
Test different ADX parameters.
-
Add stop-loss to limit losses.
Conclusion
This strategy combines the strengths of SuperTrend and ADX to identify high-probability trend reversal points, filtered by ADX for quality. With parameter tuning and mechanisms adjustments, it can become a steady profit-generating high-frequency strategy.
- 1