Overview
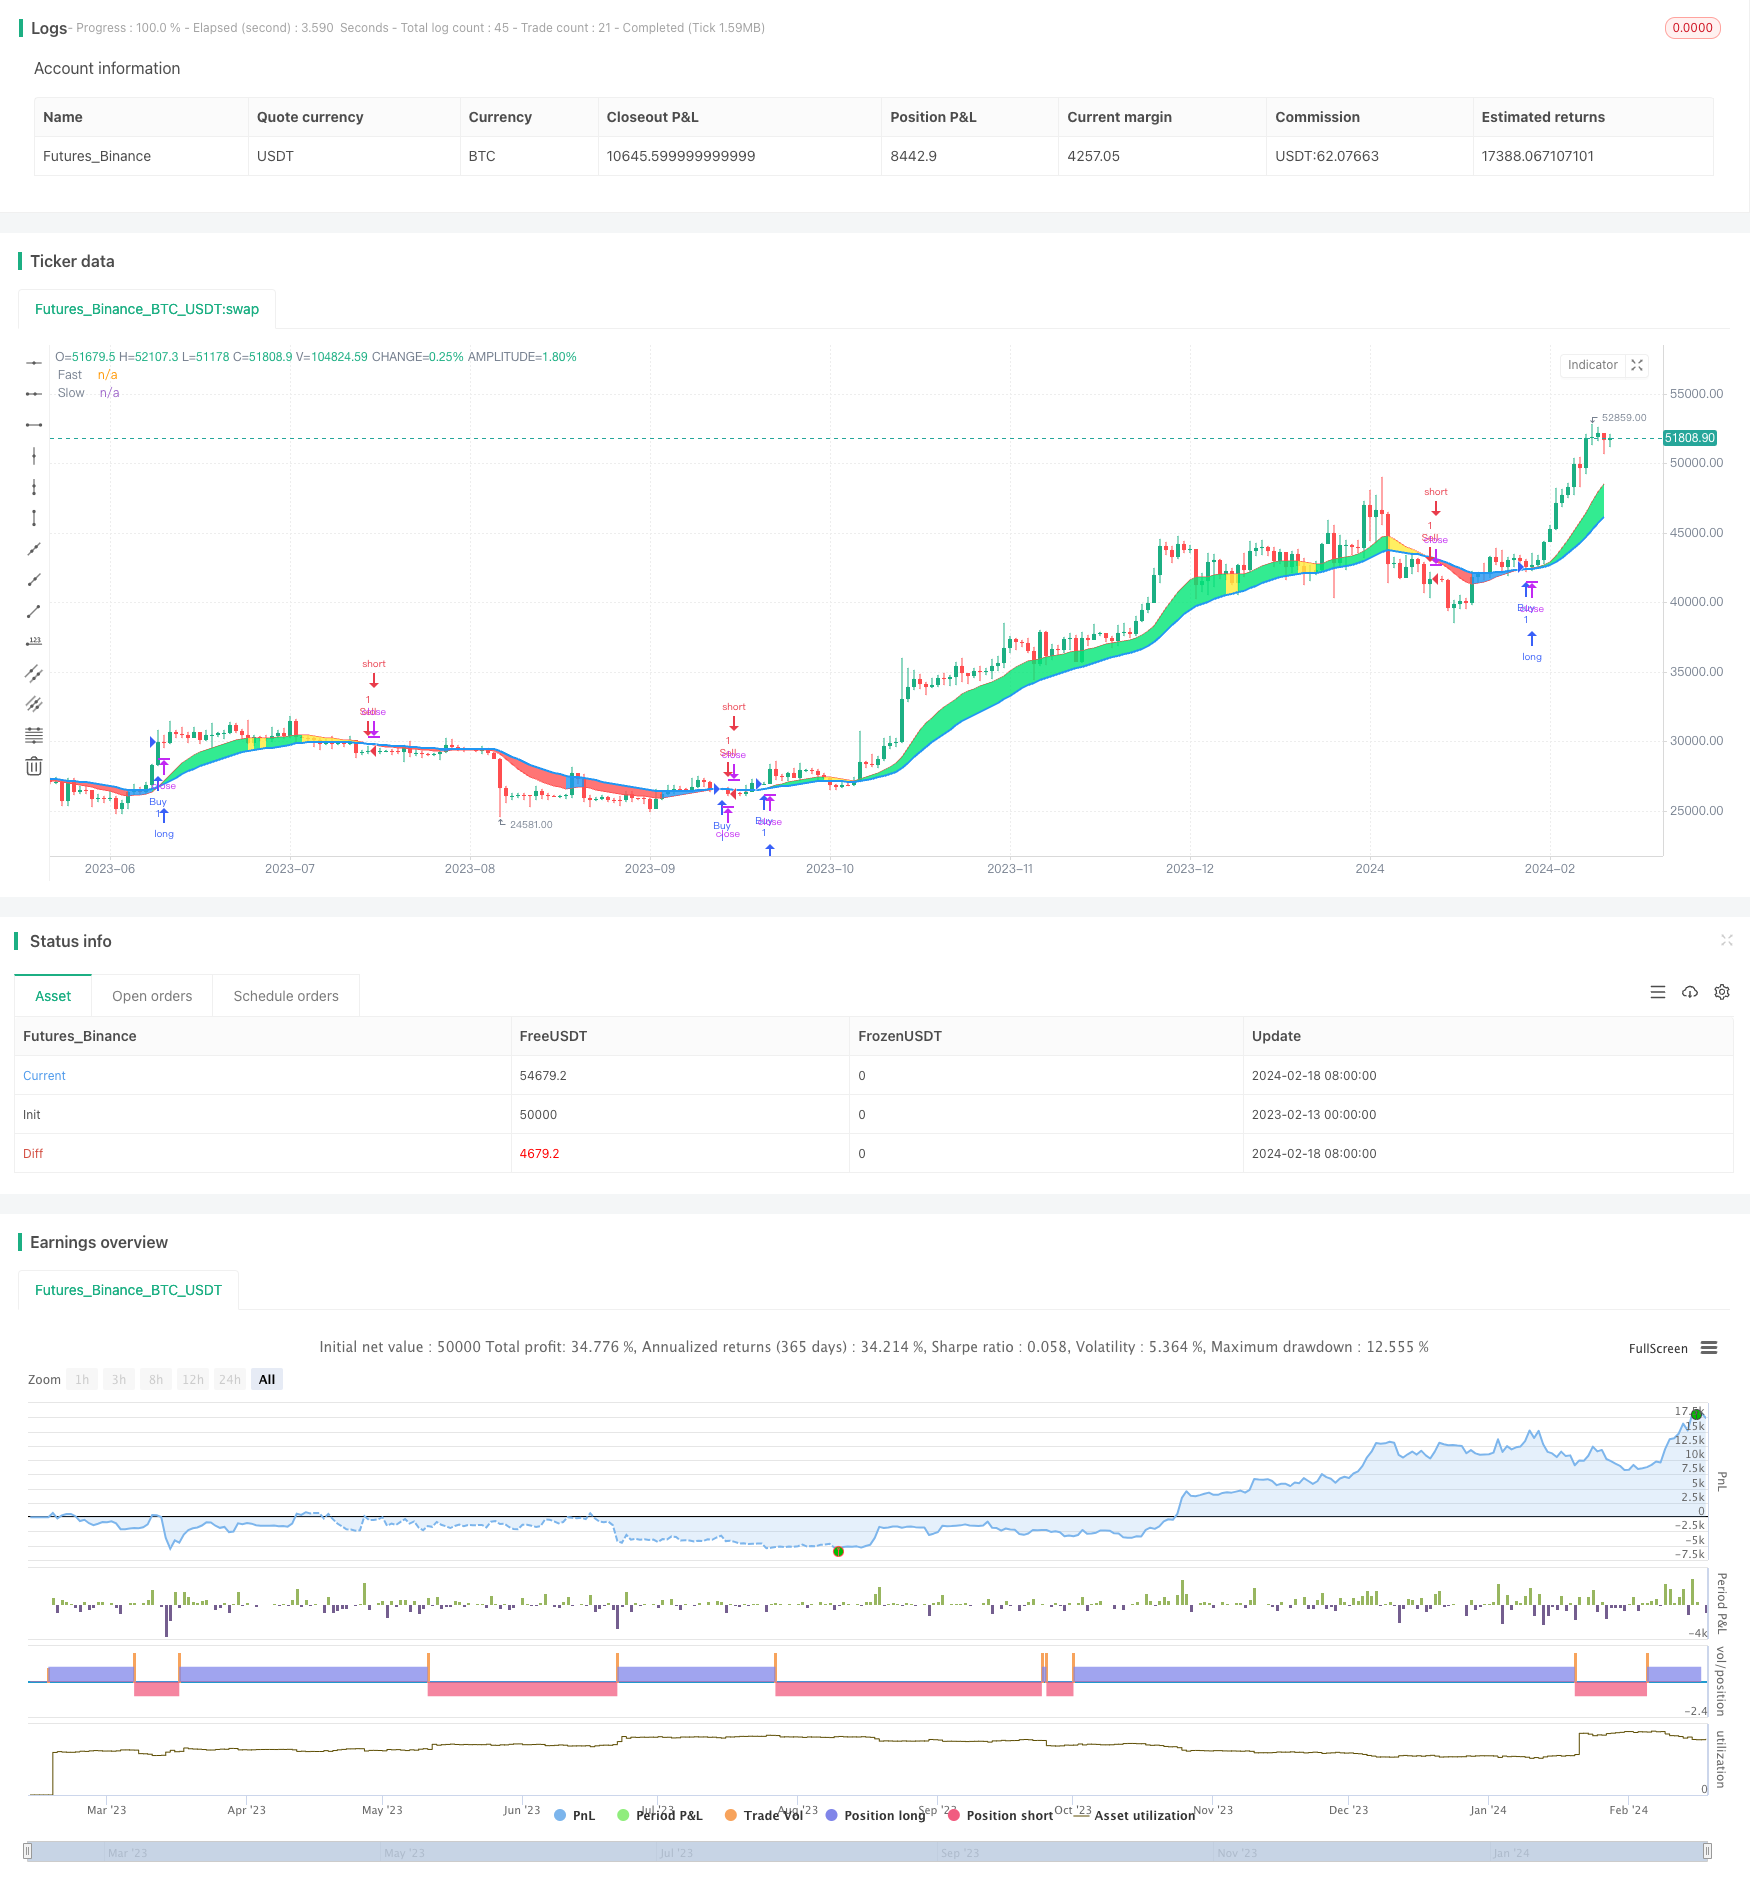
The CDC Action Zone [TS Trader] strategy is a quantitative trading strategy adapted from the CDC Action Zone indicator. The strategy uses the crossover of fast and slow moving averages as buy and sell signals. When the fast MA crosses above the slow MA, it is a buy signal. When the fast MA crosses below the slow MA, it is a sell signal.
Strategy Principle
The core indicators of this strategy are the fast and slow moving averages. The strategy first calculates the arithmetic average price, then computes the fast and slow MAs based on the user-defined period lengths. When the fast MA crosses above the slow MA, it is considered a bullish signal. When the fast MA crosses below the slow MA, it is regarded as a bearish signal.
After identifying the market trend, the strategy further judges the relationship between the closing price and the moving averages. If it is a bull market and the closing price is above the fast MA, it is a strong buy signal. If it is a bear market and the closing price is below the fast MA, it is a strong sell signal.
Based on these buy and sell signals, the strategy can carry out automated trading. When a buy signal is triggered, a long position is opened. When a sell signal is triggered, existing long positions are closed or new short positions are opened.
Advantage Analysis
The advantages of this strategy include:
- Uses moving averages as a solid theoretical foundation, easy to understand.
- Combines two MAs to filter noise and identify trends effectively.
- Further determines strong entry signals using closing price and MA relationships.
- Simple and clear logic, easy to automate.
- MA periods can be adjusted for different market conditions.
Risk Analysis
There are also some risks:
- MAs have lagging issues, may miss short-term opportunities.
- May lead to large losses during trend reversals.
- Backtest results may differ from live trading performance.
Methods like combining other indicators, shortening MA periods, etc. can help address these risks.
Optimization Directions
Some directions to optimize the strategy:
- Optimize MA periods for changing markets.
- Add indicators like volume to filter false breaks.
- Incorporate other indicators to identify trend reversals.
- Add stop loss to control losses.
Summary
In summary, the CDC Action Zone [TS Trader] strategy implements a simple yet practical quantitative trading strategy using dual moving average crosses. The strategy is easy to understand and implement but has room for further optimizations. With continuous testing and refinement, it can become a stable long-term strategy.
/*backtest
start: 2023-02-13 00:00:00
end: 2024-02-19 00:00:00
period: 1d
basePeriod: 1h
exchanges: [{"eid":"Futures_Binance","currency":"BTC_USDT"}]
*/

//@version=4
strategy("CDC Action Zone [TS Trader]", overlay=true)

// CDC ActionZone V2 29 Sep 2016
// CDC ActionZone is based on a simple 2MA and is most suitable for use with medium volatility market
// 11 Nov 2016 : Ported to Trading View with minor UI enhancement

src = input(title="Data Array", type=input.source, defval=ohlc4)
prd1 = input(title="Short MA period", type=input.integer, defval=12)
prd2 = input(title="Long MA period", type=input.integer, defval=26)

AP = ema(src, 2)
Fast = ema(AP, prd1)
Slow = ema(AP, prd2)

// === INPUT BACKTEST RANGE ===
FromYear = input(defval = 2019, title = "From Year", minval = 2009)
FromMonth = input(defval = 1, title = "From Month", minval = 1, maxval = 12)
FromDay = input(defval = 1, title = "From Day", minval = 1, maxval = 31)
ToYear = input(defval = 9999, title = "To Year", minval = 2009)
ToMonth = input(defval = 12, title = "To Month", minval = 1, maxval = 12)
ToDay = input(defval = 31, title = "To Day", minval = 1, maxval = 31)

// === FUNCTION EXAMPLE ===
start = timestamp(FromYear, FromMonth, FromDay, 00, 00)  // backtest start window
finish = timestamp(ToYear, ToMonth, ToDay, 23, 59)        // backtest finish window
window() => true
Bullish = Fast > Slow
Bearish = Fast < Slow

Green = Bullish and AP > Fast
Red = Bearish and AP < Fast
Yellow = Bullish and AP < Fast
Blue = Bearish and AP > Fast

//Long Signal
Buy = Green and Green[1] == 0
Sell = Red and Red[1] == 0

//Short Signal
Short = Red and Red[1] == 0
Cover = Red[1] and Red == 0

//Plot
l1 = plot(Fast, "Fast", linewidth=1, color=color.red)
l2 = plot(Slow, "Slow", linewidth=2, color=color.blue)
bcolor = Green ? color.lime : Red ? color.red : Yellow ? color.yellow : Blue ? color.blue : color.white
barcolor(color=bcolor)
fill(l1, l2, bcolor)

strategy.entry("Buy", strategy.long, when=window() and Buy)
strategy.entry("Sell", strategy.short, when=window() and Sell)
strategy.close("Buy", when=window() and Sell)
strategy.close("Sell", when=window() and Buy)