Overview
The extreme reversal setup strategy is a strategy that utilizes extreme K-line reversals. It will judge based on the entity size of the latest K-line and average value, and generate trading signals when the entity size is greater than the average value and a reversal occurs.
Strategy Principle
This strategy mainly judges the entity size of the current K-line and the overall size of the K-line.
It will record the entity size (difference between open and close) of the latest K-line and the overall size of the K-line (difference between highest and lowest).
Then use the Average True Range Moving Average (RMA) to calculate the average entity size and K-line size of the last 20 K-lines.
When the latest K-line rises and the entity size is greater than the average entity size, and the overall K-line size is also greater than 2 times the average K-line size, a long signal is generated.
On the contrary, when the latest K-line falls and the entity size also meets the above conditions, a short signal is generated.
That is, trading signals are generated when extreme K-lines reverse, by judging with average values.
Advantage Analysis
The main advantages of this strategy are:
- Use extreme K-line characteristics for easy reversal
- Compare extreme values of entity size and overall K-line size to find outliers
- Use RMA to calculate dynamic averages adaptable to market changes
- Combine with reversal patterns for more reliable signals
Risk Analysis
This strategy also has some risks:
- Extreme K-lines do not necessarily reverse, may continue to run
- Improper parameter settings may cause too sensitive or dull
- Requires sufficient market volatility to support, not suitable for consolidation
- May generate frequent trading signals, increasing transaction costs and slippage risks
To reduce risks, parameters can be adjusted appropriately, or stop loss can be added to control losses.
Optimization Directions
This strategy can be optimized in the following aspects:
- Add volume filter to avoid false breakouts
- Use volatility indicators to dynamically optimize parameter settings
- Combine trend indicators to avoid reverse long and short
- Add machine learning models to judge K-line reversal probability
- Add stop loss mechanism
Summary
The extreme reversal setup strategy generates trading signals when reversals occur by judging extreme situations of the latest K-line. It has the advantage of using exceptional extreme K-line features, but also has some risks. Better strategy performance can be obtained through parameter optimization and risk control measures.
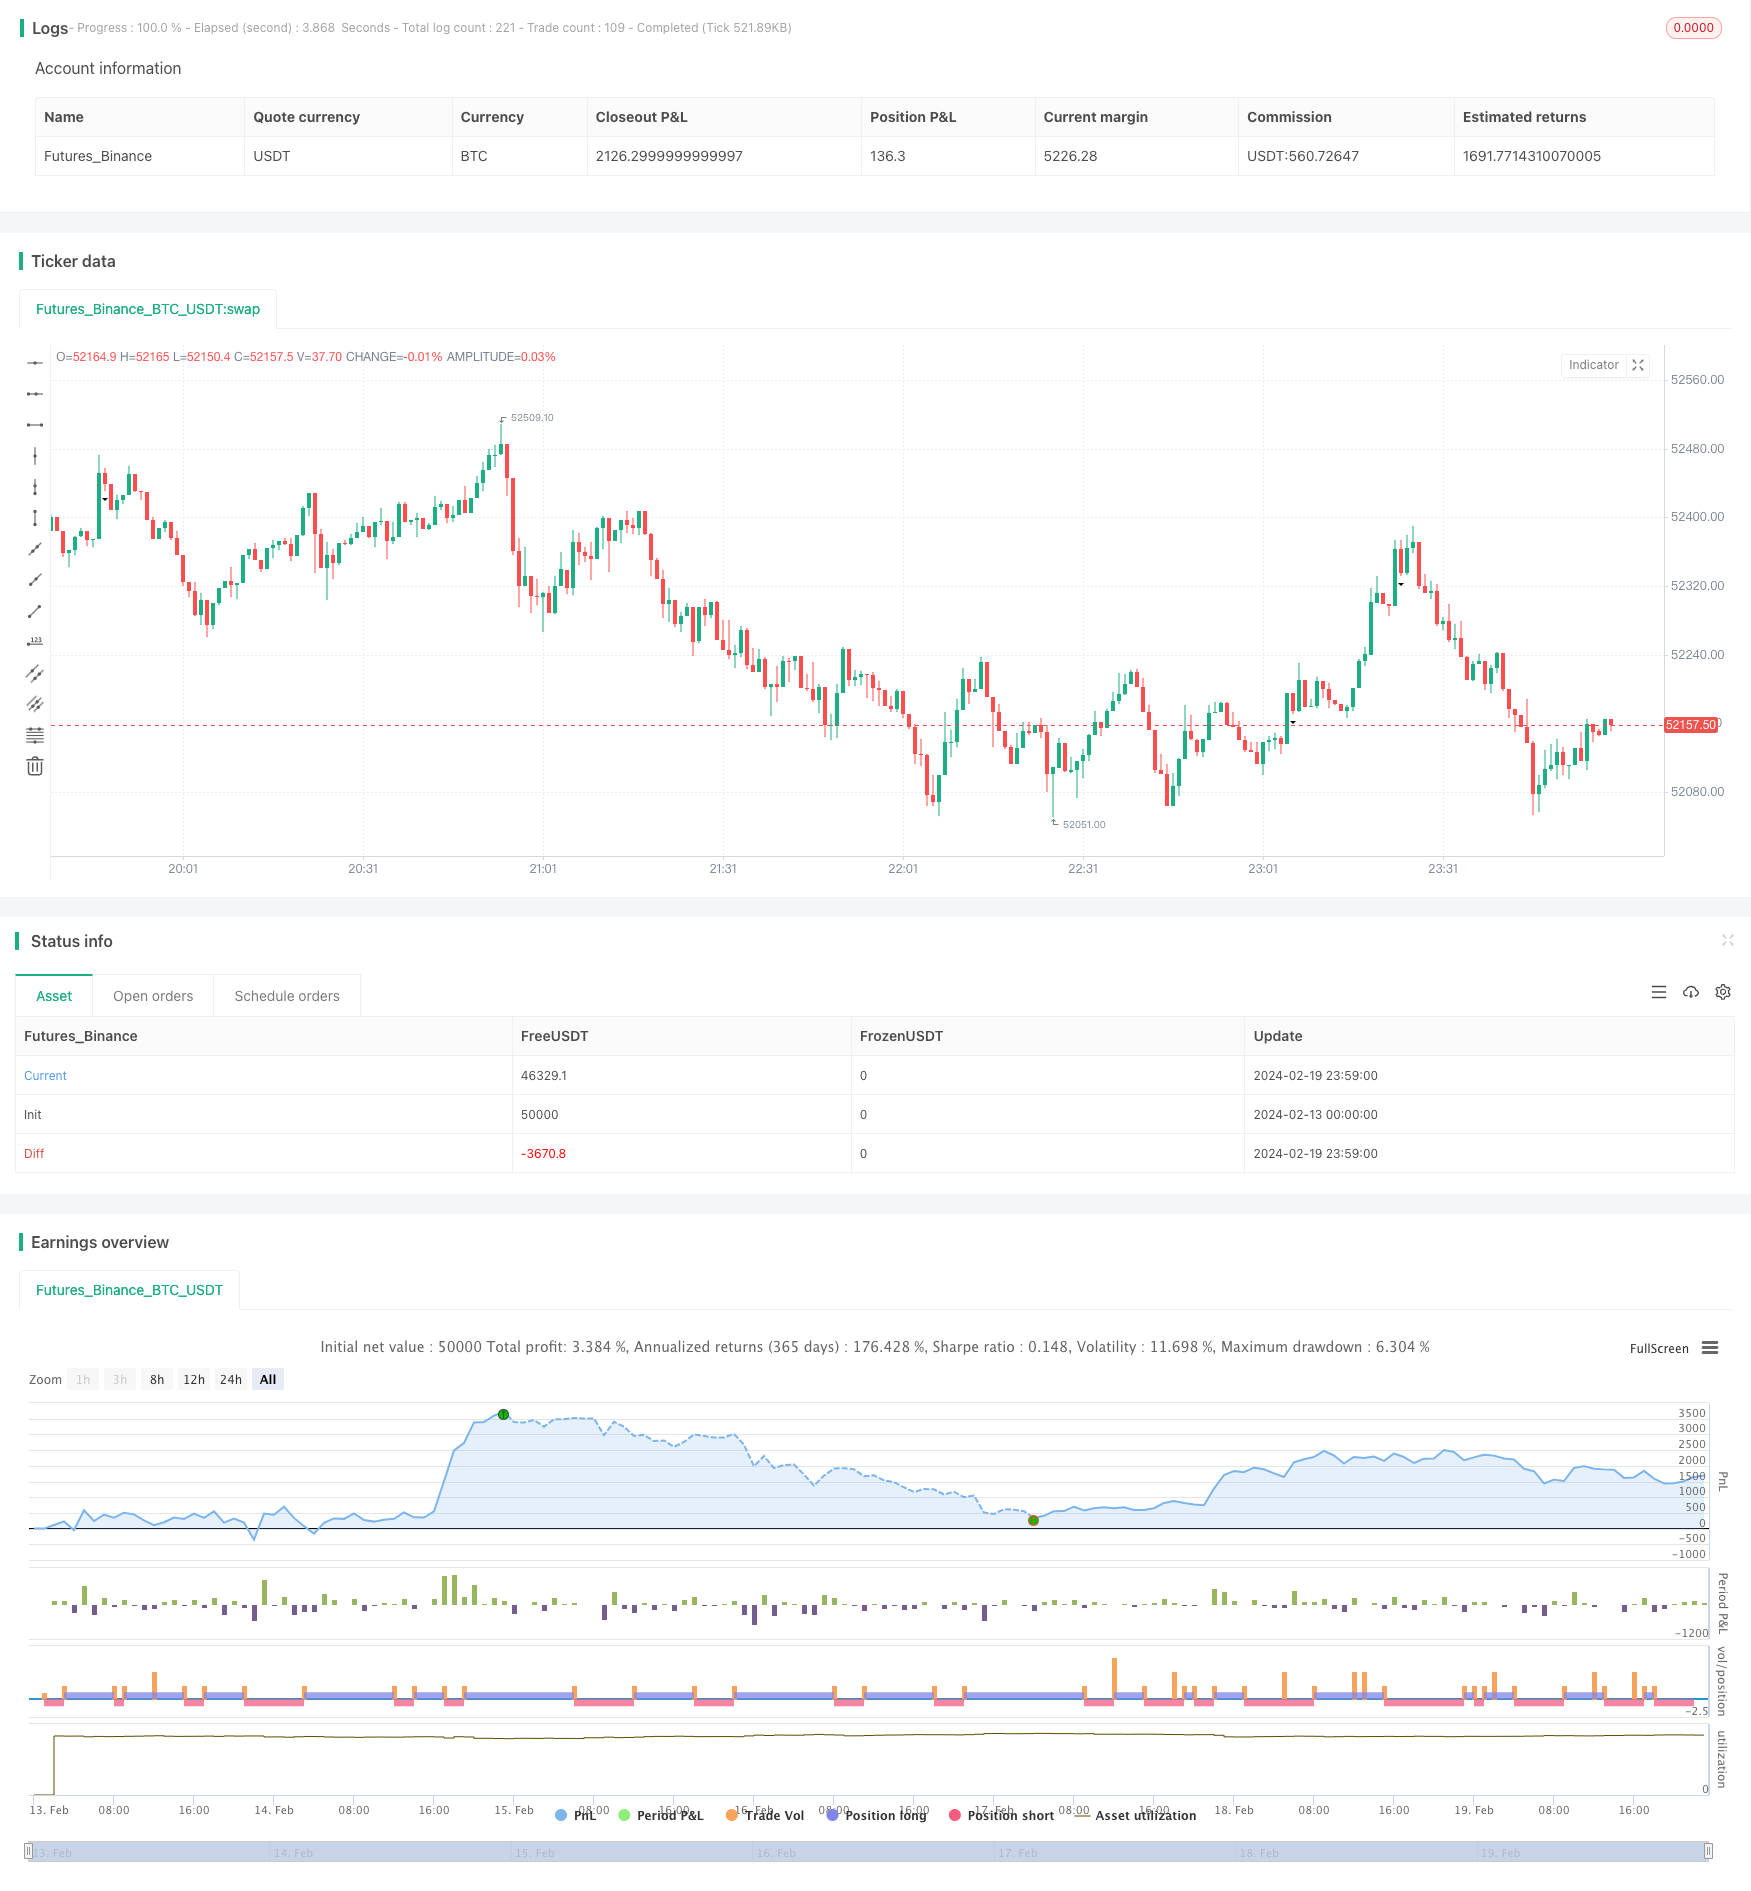
/*backtest
start: 2024-02-13 00:00:00
end: 2024-02-20 00:00:00
period: 1m
basePeriod: 1m
exchanges: [{"eid":"Futures_Binance","currency":"BTC_USDT"}]
*/

//@version=4
strategy("Extreme Reversal Setup", overlay=true)

bodySize = input(defval=0.75)
barsBack = input(title="Lookback Period", type=input.integer, defval=20, minval=0)
bodyMultiplier = input(title="Bar ATR Multiplier", type=input.float, defval=2.0, minval=0)

myBodySize = abs(close - open)
averageBody = rma(myBodySize, barsBack)
myCandleSize = abs(high - low)
averageCandle = rma(myCandleSize, barsBack)

signal_long = open[1]-close[1] >= bodySize*(high[1]-low[1]) and
   high[1]-low[1] > averageCandle*bodyMultiplier and
   open[1]-close[1] > averageBody and close > open
signal_short = close[1]-open[1] >= bodySize*(high[1]-low[1]) and
   high[1]-low[1] > averageCandle*bodyMultiplier and
   close[1]-open[1] > averageBody and open > close

plotshape(signal_long, "LONG", shape.triangleup, location.belowbar, size=size.normal)
plotshape(signal_short, "SHORT", shape.triangledown, location.belowbar, size=size.normal)

strategy.entry("LONG", strategy.long, when=signal_long)
strategy.entry("SHORT", strategy.short, when=signal_short)