
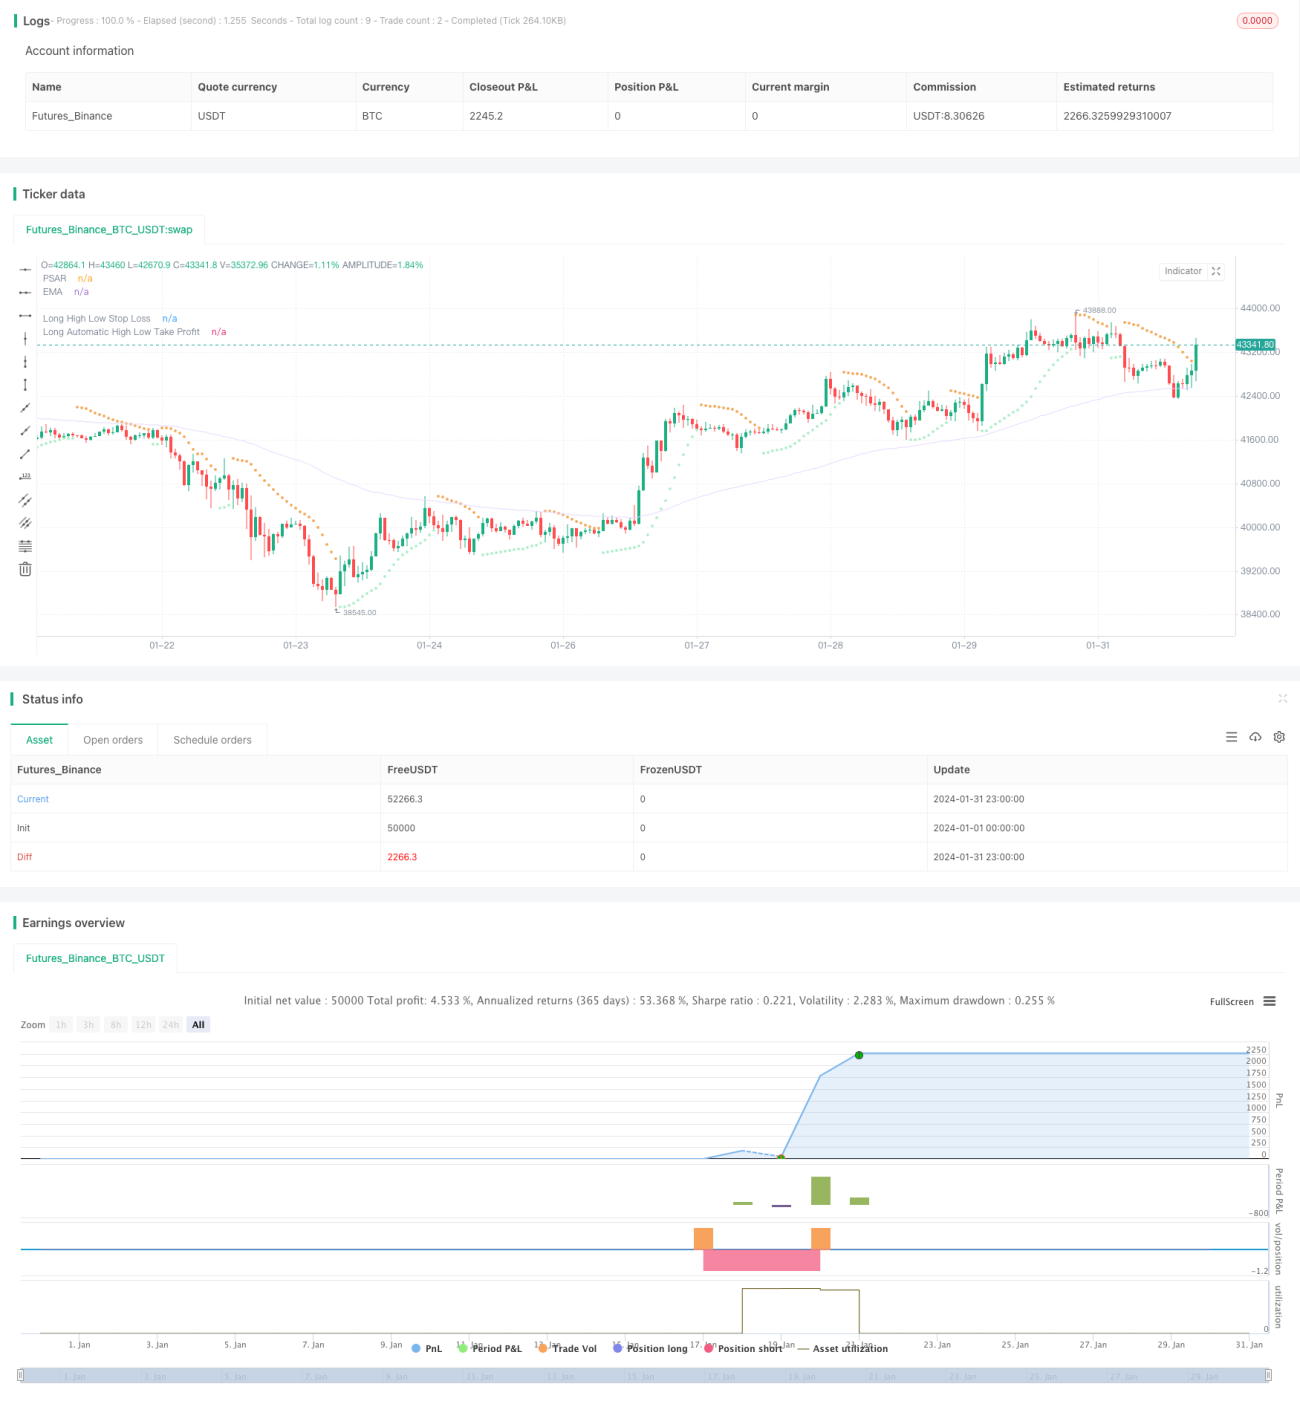
The goal of this strategy is to balance the psychology and performance of traders through adjusting various parameters, in order to obtain more steady returns. It uses indicators like moving averages, Bollinger Bands and Keltner Channels to determine market trends and volatility, together with the PSAR indicator to identify reversal signals. The TTM Squeeze indicator is leveraged to gauge momentum. Trading signals are generated through the combination of these indicators. In the meantime, risks are managed via the high-low stop loss and risk-reward take profit methods.
The core logic of this strategy is as follows:
Judge trends: the EMA moving average is used to determine the direction of price trends. Prices above EMA signify uptrends while prices below EMA indicate downtrends.
Identify reversals: the PSAR indicator spots price reversal points. PSAR dots appearing above prices signal longs while dots emerging below prices call for shorts.
Gauge momentum: the TTM Squeeze indicator measures market volatility and momentum. It compares Bollinger Bands and Keltner Channels to quantify volatility squeezes and surges. Squeeze implies extremely low volatility while a squeeze release signals an impending large directional price move.
Generate trading signals: long signals are triggered when prices crossover above the EMA line and PSAR dots, accompanied by a TTM Squeeze release. Short signals occur when prices crossover below the EMA and PSAR, together with a TTM Squeeze triggering.
Stop loss method: the high-low stop loss bases stop levels on recent high/low prices multiplied by a set factor.
Take profit method: the risk-reward take profit automatically calculates profit targets based on the stop loss distance from current prices multiplied by a preset risk-reward ratio.
The various parameters allow traders to balance psychology by controlling trade frequency, position sizing, stop loss levels and take profit points.
The main edges of this strategy include:
Higher signal accuracy from multiple indicator consensus
Mainly reversal-focused, reduces likelihood of false breakout fades
TTM Squeeze gauges consolidations to avoid ineffective trades
Simple and adjustable high-low stop loss
Risk-reward take profit quantifies profit ratio for easy tuning
Flexible parameters to match personal risk preferences
The risks of the strategy consist of:
Increased chance of missing entry signals from multiple indicators
Underperformance in persistent trending markets
Occasional stop loss breaches beyond expectations
Potential invalidation of risk-reward exits by price whipsaws
Inappropriate parameter tuning may lead to losses or over-stopping out
Possible improvement areas cover:
Add or adjust indicator weights for higher signal accuracy
Optimize reversal and trend parameters for better profit capture
Refine high-low stop loss levels for maximized effectiveness
Test different risk-reward ratios for optimum results
Adjust position sizing to minimize single-trade loss impacts
In summary, through indicator combos and tunable settings, this strategy is capable of balancing trading psychology and securing steady positive results. Despite some remaining upside, it has already demonstrated practical applicability. Further live market feedback and calibration will likely enhance it into an effective tool for managing emotions and achieving long-term stable profits.
/*backtest
start: 2024-01-01 00:00:00
end: 2024-01-31 23:59:59
period: 1h
basePeriod: 15m
exchanges: [{"eid":"Futures_Binance","currency":"BTC_USDT"}]
*/
//@version=5
// This source code is subject to the terms of the Mozilla Public License 2.0 at https://mozilla.org/MPL/2.0/
// © simwai
strategy('Octopus Nest Strategy 🐙', shorttitle='🐙', overlay=true )
// -- Colors --
color maximumYellowRed = color.rgb(255, 203, 98) // yellow
color rajah = color.rgb(242, 166, 84) // orange
color magicMint = color.rgb(171, 237, 198)
color languidLavender = color.rgb(232, 215, 255)
color maximumBluePurple = color.rgb(181, 161, 226)
color skyBlue = color.rgb(144, 226, 244)
color lightGray = color.rgb(214, 214, 214)
color quickSilver = color.rgb(163, 163, 163)
color mediumAquamarine = color.rgb(104, 223, 153)
color carrotOrange = color.rgb(239, 146, 46)
// -- Inputs --
float src = input.source(close, 'Choose Source', group='General', inline='1')
bool isSignalLabelEnabled = input.bool(title='Show Signal Labels?', defval=true, group='General', inline='2')
bool isPsarAdaptive = input.bool(title='Is PSAR Adaptive?', defval=false, group='General', inline='2')
float highLowStopLossMultiplier = input.float(defval=0.98, step=0.01, minval=0, maxval=1, title='Multiplier', group='High Low Stop Loss', inline='1')
float highLowStopLossBackupMultiplier = input.float(defval=0.98, step=0.01, minval=0, maxval=1, title='Backup Multiplier', group='High Low Stop Loss', inline='1')
int highLowStopLossLookback = input.int(defval=20, step=5, minval=1, title='Lookback', group='High Low Stop Loss', inline='2')
float automaticHighLowTakeProfitRatio = input.float(defval=1.125, step=0.1, minval=0, title='Risk Reward Ratio', group='Automatic High Low Take Profit', inline='2')
int emaLength = input.int(100, minval=2, title='Length', group='EMA', inline='1')
int ttmLength = input.int(title='Length', defval=20, minval=0, group='TTM Squeeze', inline='1')
float psarStart = input.float(0.02, 'Start', step=0.01, minval=0.0, group='PSAR', inline='1')
float psarInc = input.float(0.02, 'Increment', step=0.01, minval=0.01, group='PSAR', inline='1')
float psarMax = input.float(0.2, 'Max', step=0.05, minval=0.0, group='PSAR', inline='2')
startAFactor = input.float(0.02, 'Starting Acceleration Factor', step = 0.001, group='Adaptive PSAR', inline='1')
minStep = input.float(0.0, 'Min Step', step = 0.001, group='Adaptive PSAR', inline='1')
maxStep = input.float(0.02, 'Max Step', step = 0.001, group='Adaptive PSAR', inline='2')
maxAFactor = input.float(0.2, 'Max Acceleration Factor', step = 0.001, group='Adaptive PSAR', inline='2')
hiloMode = input.string('On', 'HiLo Mode', options = ['Off', 'On'], group='Adaptive PSAR')
adaptMode = input.string('Kaufman', 'Adaptive Mode', options = ['Off', 'Kaufman', 'Ehlers'], group='Adaptive PSAR')
adaptSmth = input.int(5, 'Adaptive Smoothing Period', minval = 1, group='Adaptive PSAR')
filt = input.float(0.0, 'Filter in Pips', group='Adaptive PSAR', minval = 0)
minChng = input.float(0.0, 'Min Change in Pips', group='Adaptive PSAR', minval = 0)
SignalMode = input.string('Only Stops', 'Signal Mode', options = ['Only Stops', 'Signals & Stops'], group='Adaptive PSAR')
// -- Functions --
tr(_high, _low, _close) => math.max(_high - _low, math.abs(_high - _close[1]), math.abs(_low - _close[1]))
// -- Calculation --
var string lastTrade = 'initial'
float _low = low
float _high = high
float _close = close
// -- TTM Squeeze – Credits to @Greeny --
bband(ttmLength, mult) =>
ta.sma(src, ttmLength) + mult * ta.stdev(src, ttmLength)
keltner(ttmLength, mult) =>
ta.ema(src, ttmLength) + mult * ta.ema(tr(_high, _low, _close), ttmLength)
e1 = (ta.highest(_high, ttmLength) + ta.lowest(_low, ttmLength)) / 2 + ta.sma(src, ttmLength)
osc = ta.linreg(src - e1 / 2, ttmLength, 0)
diff = bband(ttmLength, 2) - keltner(ttmLength, 1)
osc_color = osc[1] < osc[0] ? osc[0] >= 0 ? #00ffff : #cc00cc : osc[0] >= 0 ? #009b9b : #ff9bff
mid_color = diff >= 0 ? color.green : color.red
// -- PSAR --
// Credits to @Bjorgum
calcBaseUnit() =>
bool isForexSymbol = syminfo.type == 'forex'
bool isYenPair = syminfo.currency == 'JPY'
float result = isForexSymbol ? isYenPair ? 0.01 : 0.0001 : syminfo.mintick
// Credits to @loxx
_afact(mode,input, per, smooth) =>
eff = 0., seff = 0.
len = 0, sum = 0., max = 0., min = 1000000000.
len := mode == 'Kaufman' ? math.ceil(per) : math.ceil(math.max(20, 5 * per))
for i = 0 to len
if (mode == 'Kaufman')
sum += math.abs(input[i] - input[i + 1])
else
max := input[i] > max ? input[i] : max
min := input[i] < min ? input[i] : min
if (mode == 'Kaufman' and sum != 0)
eff := math.abs(input - input[len]) / sum
else
if (mode == 'Ehlers' and (max - min) > 0)
eff := (input - min) / (max - min)
seff := ta.ema(eff, smooth)
seff
hVal2 = nz(high[2]), hVal1 = nz(high[1]), hVal0 = high
lowVal2 = nz(low[2]), lowVal1 = nz(low[1]), lowVal0 = low
hiprice2 = nz(high[2]), hiprice1 = nz(high[1]), hiprice0 = high
loprice2 = nz(low[2]), loprice1 = nz(low[1]), loprice0 = low
upSig = 0., dnSig = 0.
aFactor = 0., step = 0., trend = 0.
upTrndSAR = 0., dnTrndSAR = 0.
length = (2 / maxAFactor - 1)
if (hiloMode == 'On')
hiprice0 := high
loprice0 := low
else
hiprice0 := src
loprice0 := hiprice0
if bar_index == 1
trend := 1
hVal1 := hiprice1
hVal0 := math.max(hiprice0, hVal1)
lowVal1 := loprice1
lowVal0 := math.min(loprice0, lowVal1)
aFactor := startAFactor
upTrndSAR := lowVal0
dnTrndSAR := 0.
else
hVal0 := hVal1
lowVal0 := lowVal1
trend := nz(trend[1])
aFactor := nz(aFactor[1])
inputs = 0.
inprice = src
if (adaptMode != 'Off')
if (hiloMode == 'On')
inprice := src
else
inprice := hiprice0
if (adaptMode == 'Kaufman')
inputs := inprice
else
if (adaptMode == 'Ehlers')
if (nz(upTrndSAR[1]) != 0.)
inputs := math.abs(inprice - nz(upTrndSAR[1]))
else
if (nz(dnTrndSAR[1]) != 0.)
inputs := math.abs(inprice - nz(dnTrndSAR[1]))
step := minStep + _afact(adaptMode, inputs, length, adaptSmth) * (maxStep - minStep)
else
step := maxStep
upTrndSAR := 0., dnTrndSAR := 0., upSig := 0., dnSig := 0.
if (nz(trend[1]) > 0)
if (nz(trend[1]) == nz(trend[2]))
aFactor := hVal1 > hVal2 ? nz(aFactor[1]) + step : aFactor
aFactor := aFactor > maxAFactor ? maxAFactor : aFactor
aFactor := hVal1 < hVal2 ? startAFactor : aFactor
else
aFactor := nz(aFactor[1])
upTrndSAR := nz(upTrndSAR[1]) + aFactor * (hVal1 - nz(upTrndSAR[1]))
upTrndSAR := upTrndSAR > loprice1 ? loprice1 : upTrndSAR
upTrndSAR := upTrndSAR > loprice2 ? loprice2 : upTrndSAR
else
if (nz(trend[1]) == nz(trend[2]))
aFactor := lowVal1 < lowVal2 ? nz(aFactor[1]) + step : aFactor
aFactor := aFactor > maxAFactor ? maxAFactor : aFactor
aFactor := lowVal1 > lowVal2 ? startAFactor : aFactor
else
aFactor := nz(aFactor[1])
dnTrndSAR := nz(dnTrndSAR[1]) + aFactor * (lowVal1 - nz(dnTrndSAR[1]))
dnTrndSAR := dnTrndSAR < hiprice1 ? hiprice1 : dnTrndSAR
dnTrndSAR := dnTrndSAR < hiprice2 ? hiprice2 : dnTrndSAR
hVal0 := hiprice0 > hVal0 ? hiprice0 : hVal0
lowVal0 := loprice0 < lowVal0 ? loprice0 : lowVal0
if (minChng > 0)
if (upTrndSAR - nz(upTrndSAR[1]) < minChng * calcBaseUnit() and upTrndSAR != 0. and nz(upTrndSAR[1]) != 0.)
upTrndSAR := nz(upTrndSAR[1])
if (nz(dnTrndSAR[1]) - dnTrndSAR < minChng * calcBaseUnit() and dnTrndSAR != 0. and nz(dnTrndSAR[1]) != 0.)
dnTrndSAR := nz(dnTrndSAR[1])
dnTrndSAR := trend < 0 and dnTrndSAR > nz(dnTrndSAR[1]) ? nz(dnTrndSAR[1]) : dnTrndSAR
upTrndSAR := trend > 0 and upTrndSAR < nz(upTrndSAR[1]) ? nz(upTrndSAR[1]) : upTrndSAR
if (trend < 0 and hiprice0 >= dnTrndSAR + filt * calcBaseUnit())
trend := 1
upTrndSAR := lowVal0
upSig := SignalMode == 'Signals & Stops' ? lowVal0 : upSig
dnTrndSAR := 0.
aFactor := startAFactor
lowVal0 := loprice0
hVal0 := hiprice0
else if (trend > 0 and loprice0 <= upTrndSAR - filt * calcBaseUnit())
trend := -1
dnTrndSAR := hVal0
dnSig := SignalMode == 'Signals & Stops' ? hVal0 : dnSig
upTrndSAR := 0.
aFactor := startAFactor
lowVal0 := loprice0
hVal0 := hiprice0
psar = upTrndSAR > 0 ? upTrndSAR : dnTrndSAR
psar := isPsarAdaptive ? psar : ta.sar(psarStart, psarInc, psarMax)
plot(psar, title='PSAR', color=src < psar ? rajah : magicMint, style=plot.style_circles)
// -- EMA --
float ema = ta.ema(src, emaLength)
plot(ema, title='EMA', color=languidLavender)
// -- Signals --
var string isTradeOpen = ''
var string signalCache = ''
bool enterLong = src > ema and ta.crossover(src, psar) and ta.crossover(osc, 0)
bool enterShort = src < ema and ta.crossunder(src, psar) and ta.crossunder(osc, 0)
// bool exitLong = ta.crossunder(src, ema)
// bool exitShort = ta.crossover(src, ema)
if (signalCache == 'long entry')
signalCache := ''
enterLong := true
else if (signalCache == 'short entry')
signalCache := ''
enterShort := true
if (isTradeOpen == '')
if (enterLong)
isTradeOpen := 'long'
else if (enterShort)
isTradeOpen := 'short'
else if (isTradeOpen == 'long')
if (enterLong)
enterLong := false
else if (isTradeOpen == 'short')
if (enterShort)
enterShort := false
plotshape((isSignalLabelEnabled and enterLong and (isTradeOpen == 'long')) ? psar : na, title='LONG', text='L', style=shape.labelup, color=mediumAquamarine, textcolor=color.white, size=size.tiny, location=location.absolute)
plotshape((isSignalLabelEnabled and enterShort and (isTradeOpen == 'short')) ? psar : na, title='SHORT', text='S', style=shape.labeldown, color=carrotOrange, textcolor=color.white, size=size.tiny, location=location.absolute)
// -- High Low Stop Loss and Take Profit --
bool isHighLowStopLossEnabled = true
bool isAutomaticHighLowTakeProfitEnabled = true
bool recalculateStopLossTakeProfit = false
bool isStrategyEntryEnabled = false
bool isLongEnabled = true
bool isShortEnabled = true
bool isStopLossTakeProfitRecalculationEnabled = true
bool longStopLossTakeProfitRecalculation = isStopLossTakeProfitRecalculationEnabled ? true : (lastTrade == 'short' or lastTrade == 'initial')
bool shortStopLossTakeProfitRecalculation = isStopLossTakeProfitRecalculationEnabled ? true : (lastTrade == 'long' or lastTrade == 'initial')
var float longHighLowStopLoss = 0
var float shortHighLowStopLoss = 0
float highLowStopLossLowest = ta.lowest(_low, highLowStopLossLookback)
float highLowStopLossHighest = ta.highest(_high, highLowStopLossLookback)
if (isHighLowStopLossEnabled)
if (((enterLong and longStopLossTakeProfitRecalculation) or recalculateStopLossTakeProfit) and (isStrategyEntryEnabled ? not(strategy.position_size > 0) : true))
if (highLowStopLossLowest == _low)
longHighLowStopLoss := _high * highLowStopLossBackupMultiplier
else if (highLowStopLossLowest > 0)
longHighLowStopLoss := highLowStopLossLowest * highLowStopLossMultiplier
if (((enterShort and shortStopLossTakeProfitRecalculation) or recalculateStopLossTakeProfit) and (isStrategyEntryEnabled ? not(strategy.position_size < 0) : true))
if (highLowStopLossHighest == _high)
shortHighLowStopLoss := _high * (1 + (1 - highLowStopLossBackupMultiplier))
else if (highLowStopLossHighest > 0)
shortHighLowStopLoss := highLowStopLossHighest * (1 + (1 - highLowStopLossMultiplier))
plot((isLongEnabled and isHighLowStopLossEnabled and (isTradeOpen == 'long')) ? longHighLowStopLoss : na, 'Long High Low Stop Loss', color=magicMint, style=plot.style_circles, trackprice=false)
plot((isShortEnabled and isHighLowStopLossEnabled and (isTradeOpen == 'short')) ? shortHighLowStopLoss : na, 'Short High Low Stop Loss ', color=rajah, style=plot.style_circles, trackprice=false)
// -- Automatic High Low Take Profit --
var float longAutomaticHighLowTakeProfit = na
var float shortAutomaticHighLowTakeProfit = na
if (isAutomaticHighLowTakeProfitEnabled)
if (((enterLong and longStopLossTakeProfitRecalculation) or recalculateStopLossTakeProfit) and (isStrategyEntryEnabled ? not(strategy.position_size > 0) : true))
longHighLowStopLossPercentage = 1 - (longHighLowStopLoss / _close)
longAutomaticHighLowTakeProfit := _close * (1 + (longHighLowStopLossPercentage * automaticHighLowTakeProfitRatio))
if (((enterShort and shortStopLossTakeProfitRecalculation) or recalculateStopLossTakeProfit) and (isStrategyEntryEnabled ? not(strategy.position_size > 0) : true))
shortHighLowStopLossPercentage = 1 - (_close / shortHighLowStopLoss)
shortAutomaticHighLowTakeProfit := _close * (1 - (shortHighLowStopLossPercentage * automaticHighLowTakeProfitRatio))
plot((isAutomaticHighLowTakeProfitEnabled and isHighLowStopLossEnabled and (isTradeOpen == 'long')) ? longAutomaticHighLowTakeProfit : na, 'Long Automatic High Low Take Profit', color=magicMint, style=plot.style_circles, trackprice=false)
plot((isAutomaticHighLowTakeProfitEnabled and isHighLowStopLossEnabled and (isTradeOpen == 'short')) ? shortAutomaticHighLowTakeProfit : na, 'Short Automatic High Low Take Profit', color=rajah, style=plot.style_circles, trackprice=false)
// log.info('Automatic Long High Low Take Profit: ' + str.tostring(longAutomaticHighLowTakeProfit))
// log.info('Automatic Short High Low Take Profit: ' + str.tostring(shortAutomaticHighLowTakeProfit))
// log.info('Long High Low Stop Loss: ' + str.tostring(longHighLowStopLoss))
// log.info('Short High Low Stop Loss: ' + str.tostring(shortHighLowStopLoss))
bool longHighLowStopLossCondition = ta.crossunder(_close, longHighLowStopLoss)
bool shortHighLowStopLossCondition = ta.crossover(_close, shortHighLowStopLoss)
bool longAutomaticHighLowTakeProfitCondition = ta.crossover(_close, longAutomaticHighLowTakeProfit)
bool shortAutomaticHighLowTakeProfitCondition = ta.crossunder(_close, shortAutomaticHighLowTakeProfit)
bool exitLong = (longHighLowStopLossCondition or longAutomaticHighLowTakeProfitCondition) and strategy.position_size > 0
bool exitShort = (shortHighLowStopLossCondition or shortAutomaticHighLowTakeProfitCondition) and strategy.position_size < 0
plotshape((isSignalLabelEnabled and exitLong and (isTradeOpen == 'long')) ? psar : na, title='LONG EXIT', style=shape.circle, color=magicMint, size=size.tiny, location=location.absolute)
plotshape((isSignalLabelEnabled and exitShort and (isTradeOpen == 'short')) ? psar : na, title='SHORT EXIT', style=shape.circle, color=rajah, size=size.tiny, location=location.absolute)
// Long Exits
if (exitLong)
strategy.close('long', comment=longAutomaticHighLowTakeProfitCondition ? 'EXIT_LONG_TP' : 'EXIT_LONG_SL')
isTradeOpen := ''
// Short Exits
if (exitShort)
strategy.close('short', comment=shortAutomaticHighLowTakeProfitCondition ? 'EXIT_SHORT_TP' : 'EXIT_SHORT_SL')
isTradeOpen := ''
// Long Entries
if (enterLong and (strategy.position_size == 0))
strategy.entry('long', strategy.long, comment='ENTER_LONG')
// Short Entries
if (enterShort and (strategy.position_size == 0))
strategy.entry('short', strategy.short, comment='ENTER_SHORT')
// Save last trade state
if (enterLong or exitLong)
lastTrade := 'long'
if (enterShort or exitShort)
lastTrade := 'short'
barcolor(color=isTradeOpen == 'long' ? mediumAquamarine : isTradeOpen == 'short' ? carrotOrange : na)