Elliott Wave Strategy with 200 Day Moving Average

Overview
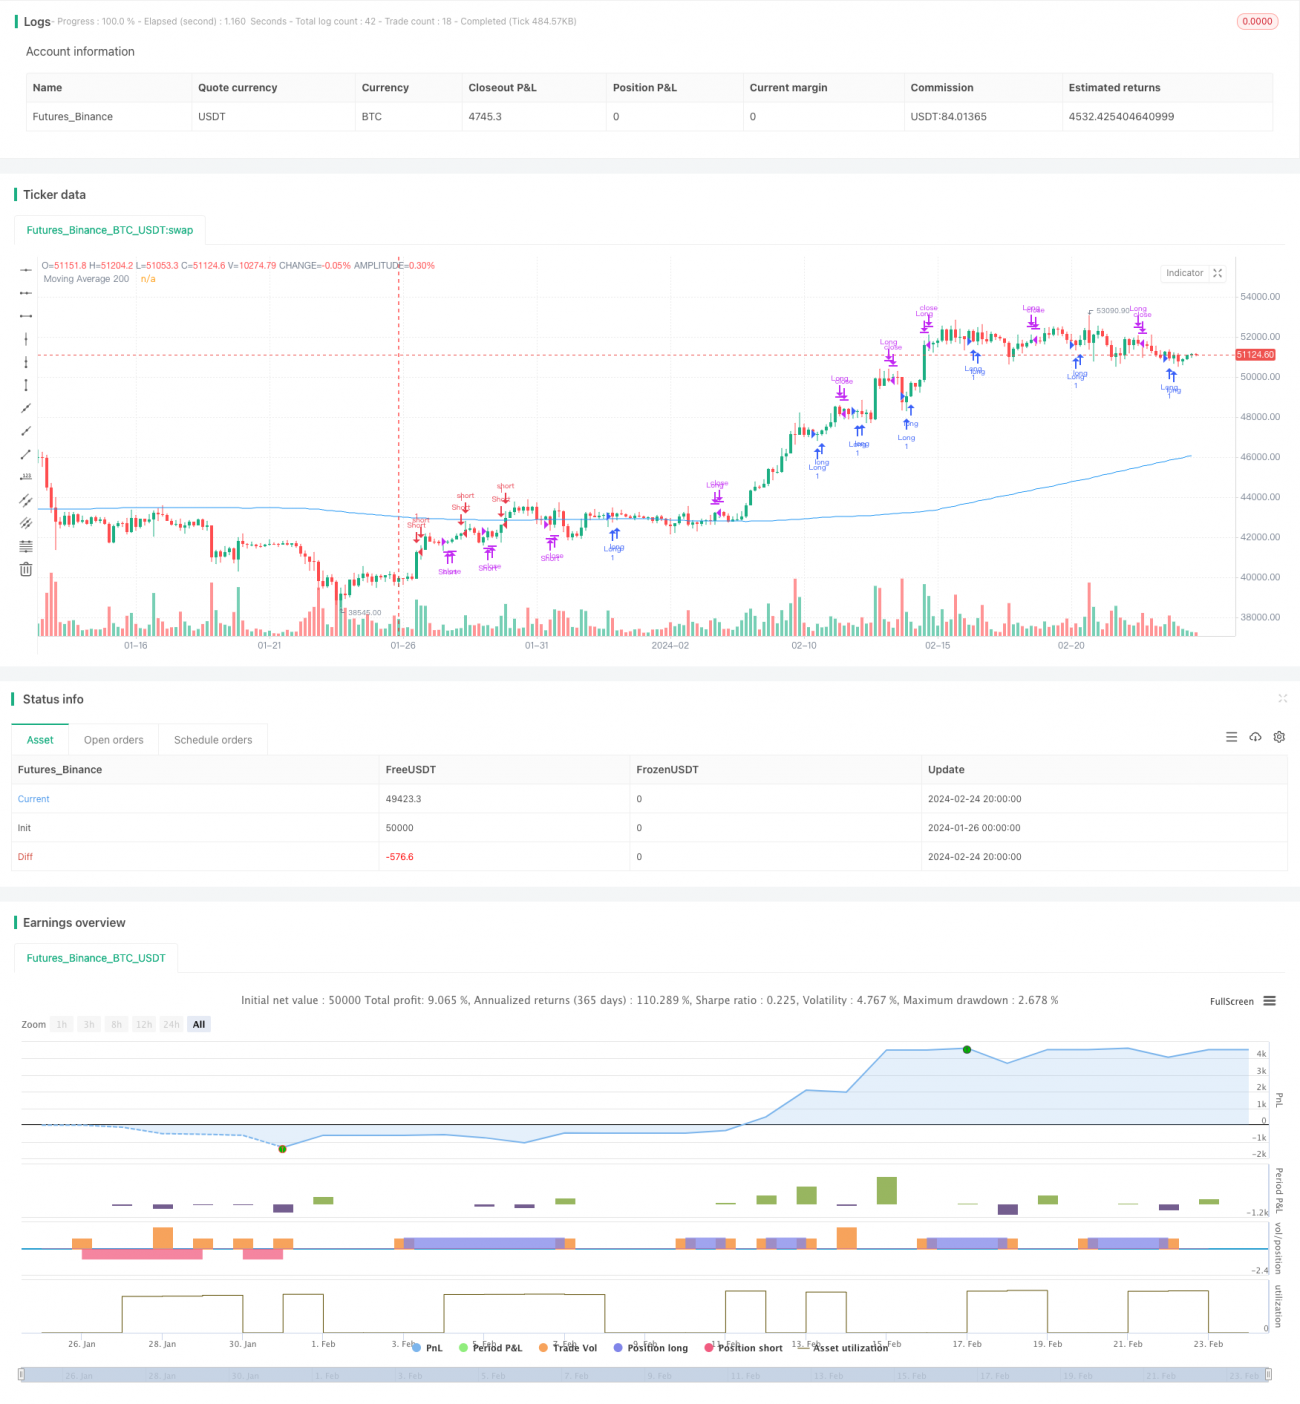
This strategy combines Elliott Wave theory and 200-day moving average indicator to achieve automated trend following and profit taking trading. Its basic logic is to determine the trend direction when Elliott 5-wave patterns appear, and issue trading signals with the 200-day moving average as an auxiliary condition.
Strategy Principle
Elliott Wave theory divides market price fluctuations into 5-wave segments. Odd-numbered waves are motive waves and even-numbered waves are corrective waves. When the high points of Wave1, Wave3 and Wave5 push up in sequence, and Wave2 and Wave4 retract effectively in sequence, it is judged as an upward wave combination, which belongs to a bull market. The strategy goes long at this time. On the contrary, when the low points of Wave1, Wave3 and Wave5 push down in sequence, and Wave2 and Wave4 retract effectively in sequence, it is judged as a downward wave combination, which belongs to a bear market. The strategy goes short at this time.
The strategy also introduces the 200-day moving average indicator as an auxiliary judgment condition. Only when a bullish or bearish Elliott wave pattern is identified and the closing price of the day exceeds the 200-day moving average line can a long position be taken, and a short position can be taken only if the closing price of the day breaks below the 200-day moving average line.
After the long and short signals are issued, the opposite direction five waves exit the position.
Advantage Analysis
- Using Elliott wave theory to determine market trends and key points can capture market turns in a timely manner.
- Based on the 200-day moving average indicator filter to avoid being trapped in a range-bound market.
- Overall, this strategy can achieve good profits in the medium-to-long term in the stock market or futures market.
Risk Analysis
- In live trading, price fluctuations may not perfectly match the five-wave patterns described in Elliott theory, so there is a certain risk of misjudgment.
- Relying solely on the five-wave pattern cannot determine the position and significance of this wave segment in the larger market context.
- It is easy to generate wrong trading signals and losses in sideways markets.
- It does not consider the dynamic impact of stock price fluctuations on the position of the 200-day moving average.
Optimization Directions
- More indicators can be combined for filtering, such as MACD, KDJ, etc., to reduce misjudgment rate.
- Optimize the five-wave pattern recognition algorithm to improve accuracy.
- Increase judgment on whether the current wave segment is in an upward or downward wave at a larger level to avoid trading against the trend.
- Incorporate indicators like trading volume changes to determine true trend reversal points.
- Consider dynamic adjustments taking into account stock price fluctuations on 200-day moving average position.
Summary
This strategy integrates the advantages of wave theory and trend-following indicators, and performs well in capturing market key points and controlling trading risks. However, relying solely on price information means there is room for improving effectiveness in complex market conditions. Strict monitoring and continuous adjustment during live trading are necessary to achieve long-term steady profits.
- 1