Overview
This strategy combines Bollinger Bands and RSI indicators to generate trading signals. It monitors whether the closing prices of three candlesticks break through the upper or lower bands at the same time, and combines the Vortex indicator and RSI indicator to confirm trading signals.
Strategy Principle
The strategy is mainly based on the following principles:
- Use 20-period Bollinger Bands, consider issuing trading signals when prices break through the upper or lower bands on close
- Require three candlesticks to break through at the same time to avoid false breakouts
- Combine the Vortex indicator, when strongly overbought VIP>1.25, when strongly oversold VIM>1.25, filter out signals
- Combine the RSI indicator to determine overbought and oversold, consider going short when RSI breaks through 70, and consider going long when RSI breaks through 30
- When the above conditions are met, long and short signals are generated
Advantage Analysis
The main advantages of this strategy are:
- Triple BB bands filter out false breakouts and ensure the reliability of breakouts
- The Vortex indicator judges the strength of the market and avoids unfavorable trading in the market
- The RSI indicator judges the overbought and oversold area, combined with the Bollinger Bands indicator for entry
- The combination of multiple indicators comprehensively judges the market situation, and the signal reliability is relatively high
Risk Analysis
The strategy also has some risks:
- Bollinger Bands indicator is very sensitive to parameters, length and StdDev multiplier need to be optimized
- The Vortex indicator is also quite sensitive to the cycle parameter, which needs to be adjusted for different markets
- The RSI indicator is prone to divergence and may also miss trends
- If there is disagreement in the judgment of the three indicators, it will be impossible to enter, missing some opportunities
Risk control measures include:
- Optimize parameters and use parameters with the highest win rate in backtesting
- Combine other indicators, such as trading volume filtering
- Appropriately relax the indicator judgment logic to prevent missing good opportunities
Optimization Directions
The strategy can be optimized in the following aspects:
- Optimize the length and StdDev multiplier of Bollinger Bands to find the optimal parameters
- Optimize the cycle of the Vortex indicator to make it more suitable for different markets
- Increase other indicators’ judgment, such as trading volume, macd, etc., to enrich diversified signals
- Adjust indicator judgment logic to prevent inability to enter due to indicator divergence
- Increase stop loss strategy to control maximum loss per trade
Summary
This strategy combines multiple indicators for judgment. While ensuring signal reliability, it also has some problems. Through parameter optimization, enriched signal sources, adjusted judgment logic and stop loss, etc., the stability and profitability of the strategy can be further enhanced. It provides a good idea for quantitative trading.
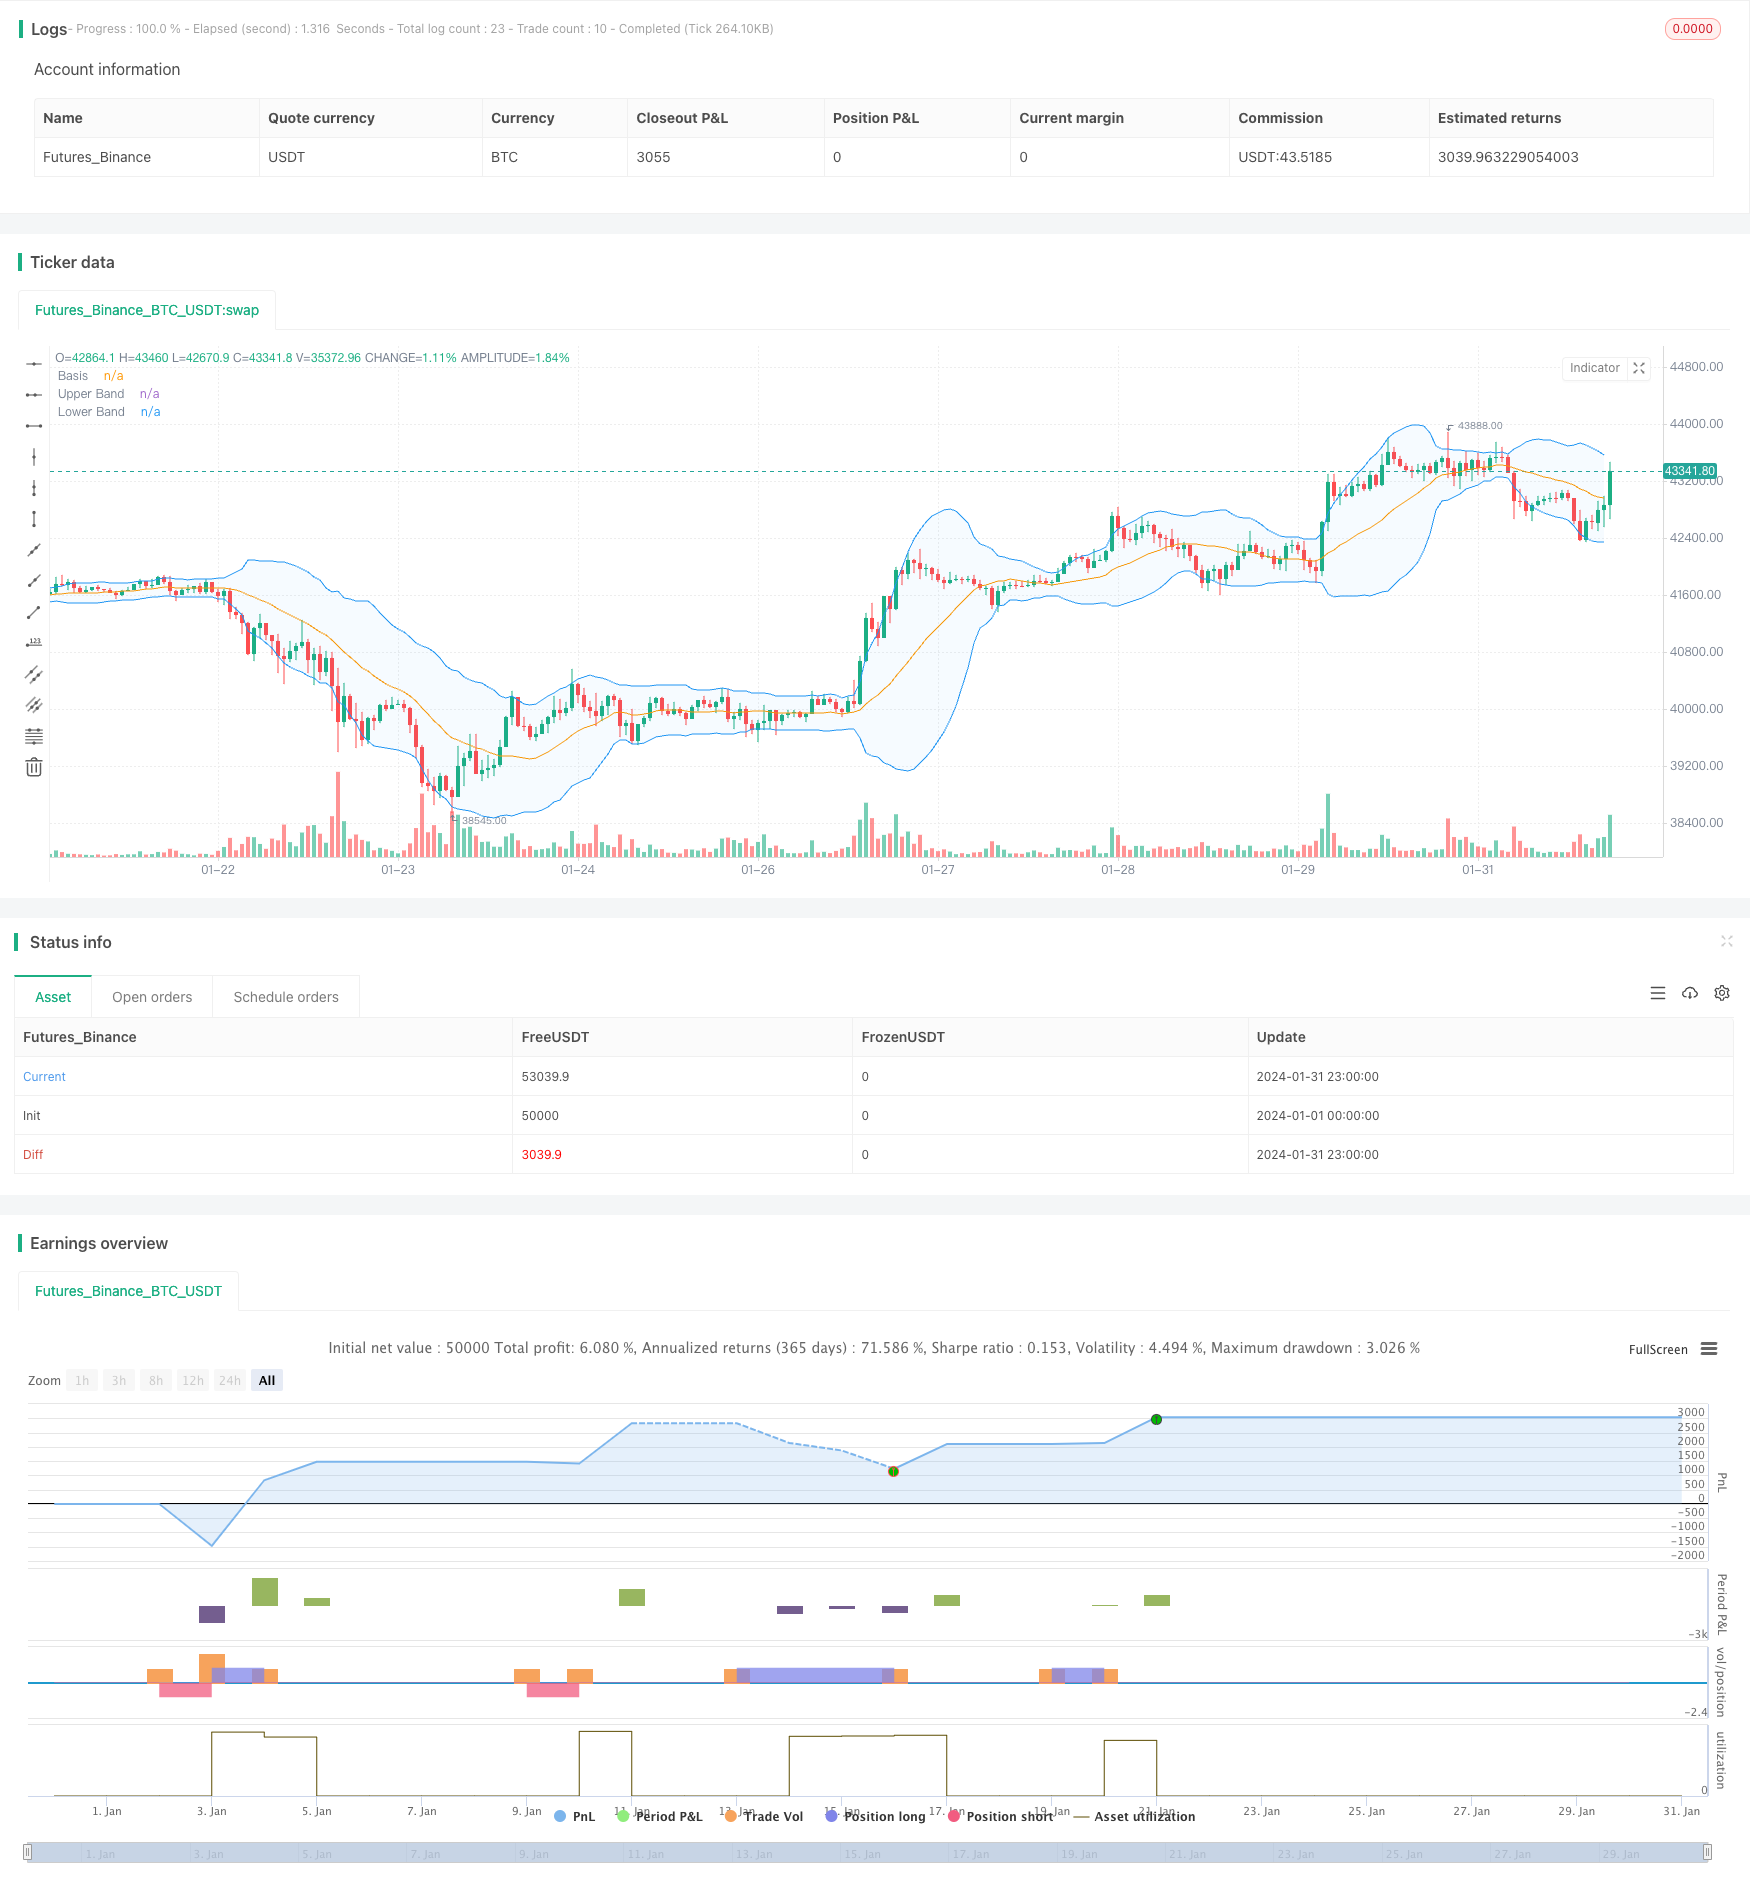
/*backtest
start: 2024-01-01 00:00:00
end: 2024-01-31 23:59:59
period: 1h
basePeriod: 15m
exchanges: [{"eid":"Futures_Binance","currency":"BTC_USDT"}]
*/

// This Pine Script™ code is subject to the terms of the Mozilla Public License 2.0 at https://mozilla.org/MPL/2.0/
// © Noway0utstorm

//@version=5
strategy(title='RSI + BB  over 3 bar+--- vortex0.71.3  ', shorttitle='NoWaytruongphuthinh', format=format.price, precision=4,overlay = true)

length = input(20, title="Length")
mult = input(2.0, title="Multiplier")
source = close

basis = ta.sma(source, length)
dev = mult * ta.stdev(source, length)

upperBand = basis + dev
lowerBand = basis - dev

isClosedBar = ta.change(time("15"))

var bool closeAboveUpperBand = false
var bool closeBelowLowerBand = false


// Vortex Indicator Settings
period_ = input.int(14, title='Period', minval=2)

VMP = math.sum(math.abs(high - low[1]), period_)
VMM = math.sum(math.abs(low - high[1]), period_)
STR = math.sum(ta.atr(1), period_)
VIP = VMP / STR
VIM = VMM / STR

//
lengthrsi = input(14, title="RSI Length")
overboughtLevel = input(70, title="Overbought Level")
oversoldLevel = input(30, title="Oversold Level")

sourcersi = close
rsiValue = ta.rsi(sourcersi, lengthrsi)

shouldShort = rsiValue > overboughtLevel
shouldLong = rsiValue < oversoldLevel


if bool(isClosedBar[1]) and bool(isClosedBar[2]) and bool(isClosedBar[3])

    if close[1] > upperBand[1] and close[2] > upperBand[2] and close[3] > upperBand[3] and VIP > 1.25 and VIM < 0.7 and rsiValue > overboughtLevel
        strategy.entry("Short", strategy.short)
        closeAboveUpperBand := false  // Reset the condition when entering a new Short position
    if close[1] < lowerBand[1] and close[2] < lowerBand[2] and close[3] < lowerBand[3] and VIP < 0.7 and VIM > 1.25 and rsiValue < oversoldLevel
        strategy.entry("Long", strategy.long)
        closeBelowLowerBand := false  // Reset the condition when entering a new Long position


if strategy.position_size > 0  // Check if there is an open Long position
    closeAboveUpperBand := close > upperBand  // Update the condition based on close price
    if closeAboveUpperBand
        strategy.close("Long",disable_alert=true)  // Close the Long position if close price is above upper band

if strategy.position_size < 0  // Check if there is an open Short position
    closeBelowLowerBand := close < lowerBand  // Update the condition based on close price
    if closeBelowLowerBand
        strategy.close("Short",disable_alert=true)  // Close the Short position if close price is below lower band

// Plots
plot(basis, color=color.orange, title="Basis")
p1 = plot(upperBand, color=color.blue, title="Upper Band")
p2 = plot(lowerBand, color=color.blue, title="Lower Band")
fill(p1, p2, title = "Background", color=color.rgb(33, 150, 243, 95))