Overview
This strategy sets stop-loss points based on recent highest highs and lowest lows to quickly enter trends and strictly control risks. It enters long positions when prices rise consecutively and short positions when prices fall consecutively. When holding positions, the stop-loss level for long positions is the lowest low of the recent few bars, and the stop-loss level for short positions is the highest high. This dynamic stop-loss approach can efficiently capture trends while strictly limiting losses.
Strategy Principles
- Use the
inputfunction to set the lookback periodshiLenandloLenfor highest highs and lowest lows, defaulting to 20. - Calculate the highest high
hiHighsup to the previous bar usingta.highest(high, hiLen)[1], and the lowest lowloLowsusingta.lowest(low, loLen)[1]. - Plot the stop-loss levels, with
loLowsfor long positions andhiHighsfor short positions. Don’t plot when flat for easy confirmation. - Define trade signal conditions:
higherCloses: the last 3 bars have consecutively higher closeslowerCloses: the last 3 bars have consecutively lower closes
isFlat: no current position
- Entry: enter long when
isFlatandhigherCloses, enter short whenisFlatandlowerCloses. - Stop-loss: for long positions, stop out at
loLows; for short positions, stop out athiHighs.
In short, this strategy uses recent highest highs and lowest lows to set trailing stops, quickly entering strong trends and strictly limiting losses, thus efficiently capturing trend profits.
Advantage Analysis
- Simple and effective: the strategy has clear and simple logic, setting stops based on prices themselves to effectively capture trends.
- Quick entry: entering on 3 consecutive bars moving in the same direction allows quickly entering new trends.
- Strict stops: stops are set at recent extreme prices, closely tied to current prices for strict risk control.
- Trailing stops: stop levels are continuously updated with prices, both locking in profits and retaining trend room.
- Highly adaptable: suitable for various markets and instruments, with flexibly adjustable parameters.
Risk Analysis
- Choppy market risk: choppy markets can cause frequent entries and stops, degrading performance. Avoid choppy markets or increase entry conditions to filter.
- Trend end risk: when a trend is about to reverse, a new entry may immediately face reversal and loss. Use trend identification indicators to exit in time.
- Extreme movement risk: in extreme oversold bounces or overbought drops, trailing stops may not protect positions well. Set fixed stop levels.
- Parameter risk: improper parameters can cause overly frequent entries and exits. Perform parameter optimization.
Optimization Directions
- Trend identification: add trend indicators like moving averages and only trade in the major trend direction to improve win rate.
- Incorporate volatility: adjust parameters based on volatility indicators like ATR to adapt to different volatilities.
- Momentum confirmation: add momentum indicators like MACD to confirm entries only with momentum support.
- Optimize stops: combine with percentage stops for extreme moves; add protective stops to reduce per-trade losses.
- Position sizing: optimize position sizing, e.g. adjust size based on risk levels to improve risk-reward ratio.
Summary
This highest high/lowest low stop strategy sets dynamic stops based on prices themselves to efficiently capture strong trends and strictly control risks. Its advantages are simplicity, effectiveness, quick entries, strict stops, and high adaptability. However, it performs poorly in choppy markets, trend ends, and extreme movements, and requires attention to parameter settings. Future improvements can add trend and momentum confirmation, optimize stops and position sizing. Overall, it is a simple and effective strategy balancing trend-capturing and risk control that deserves in-depth research and optimization in practice.
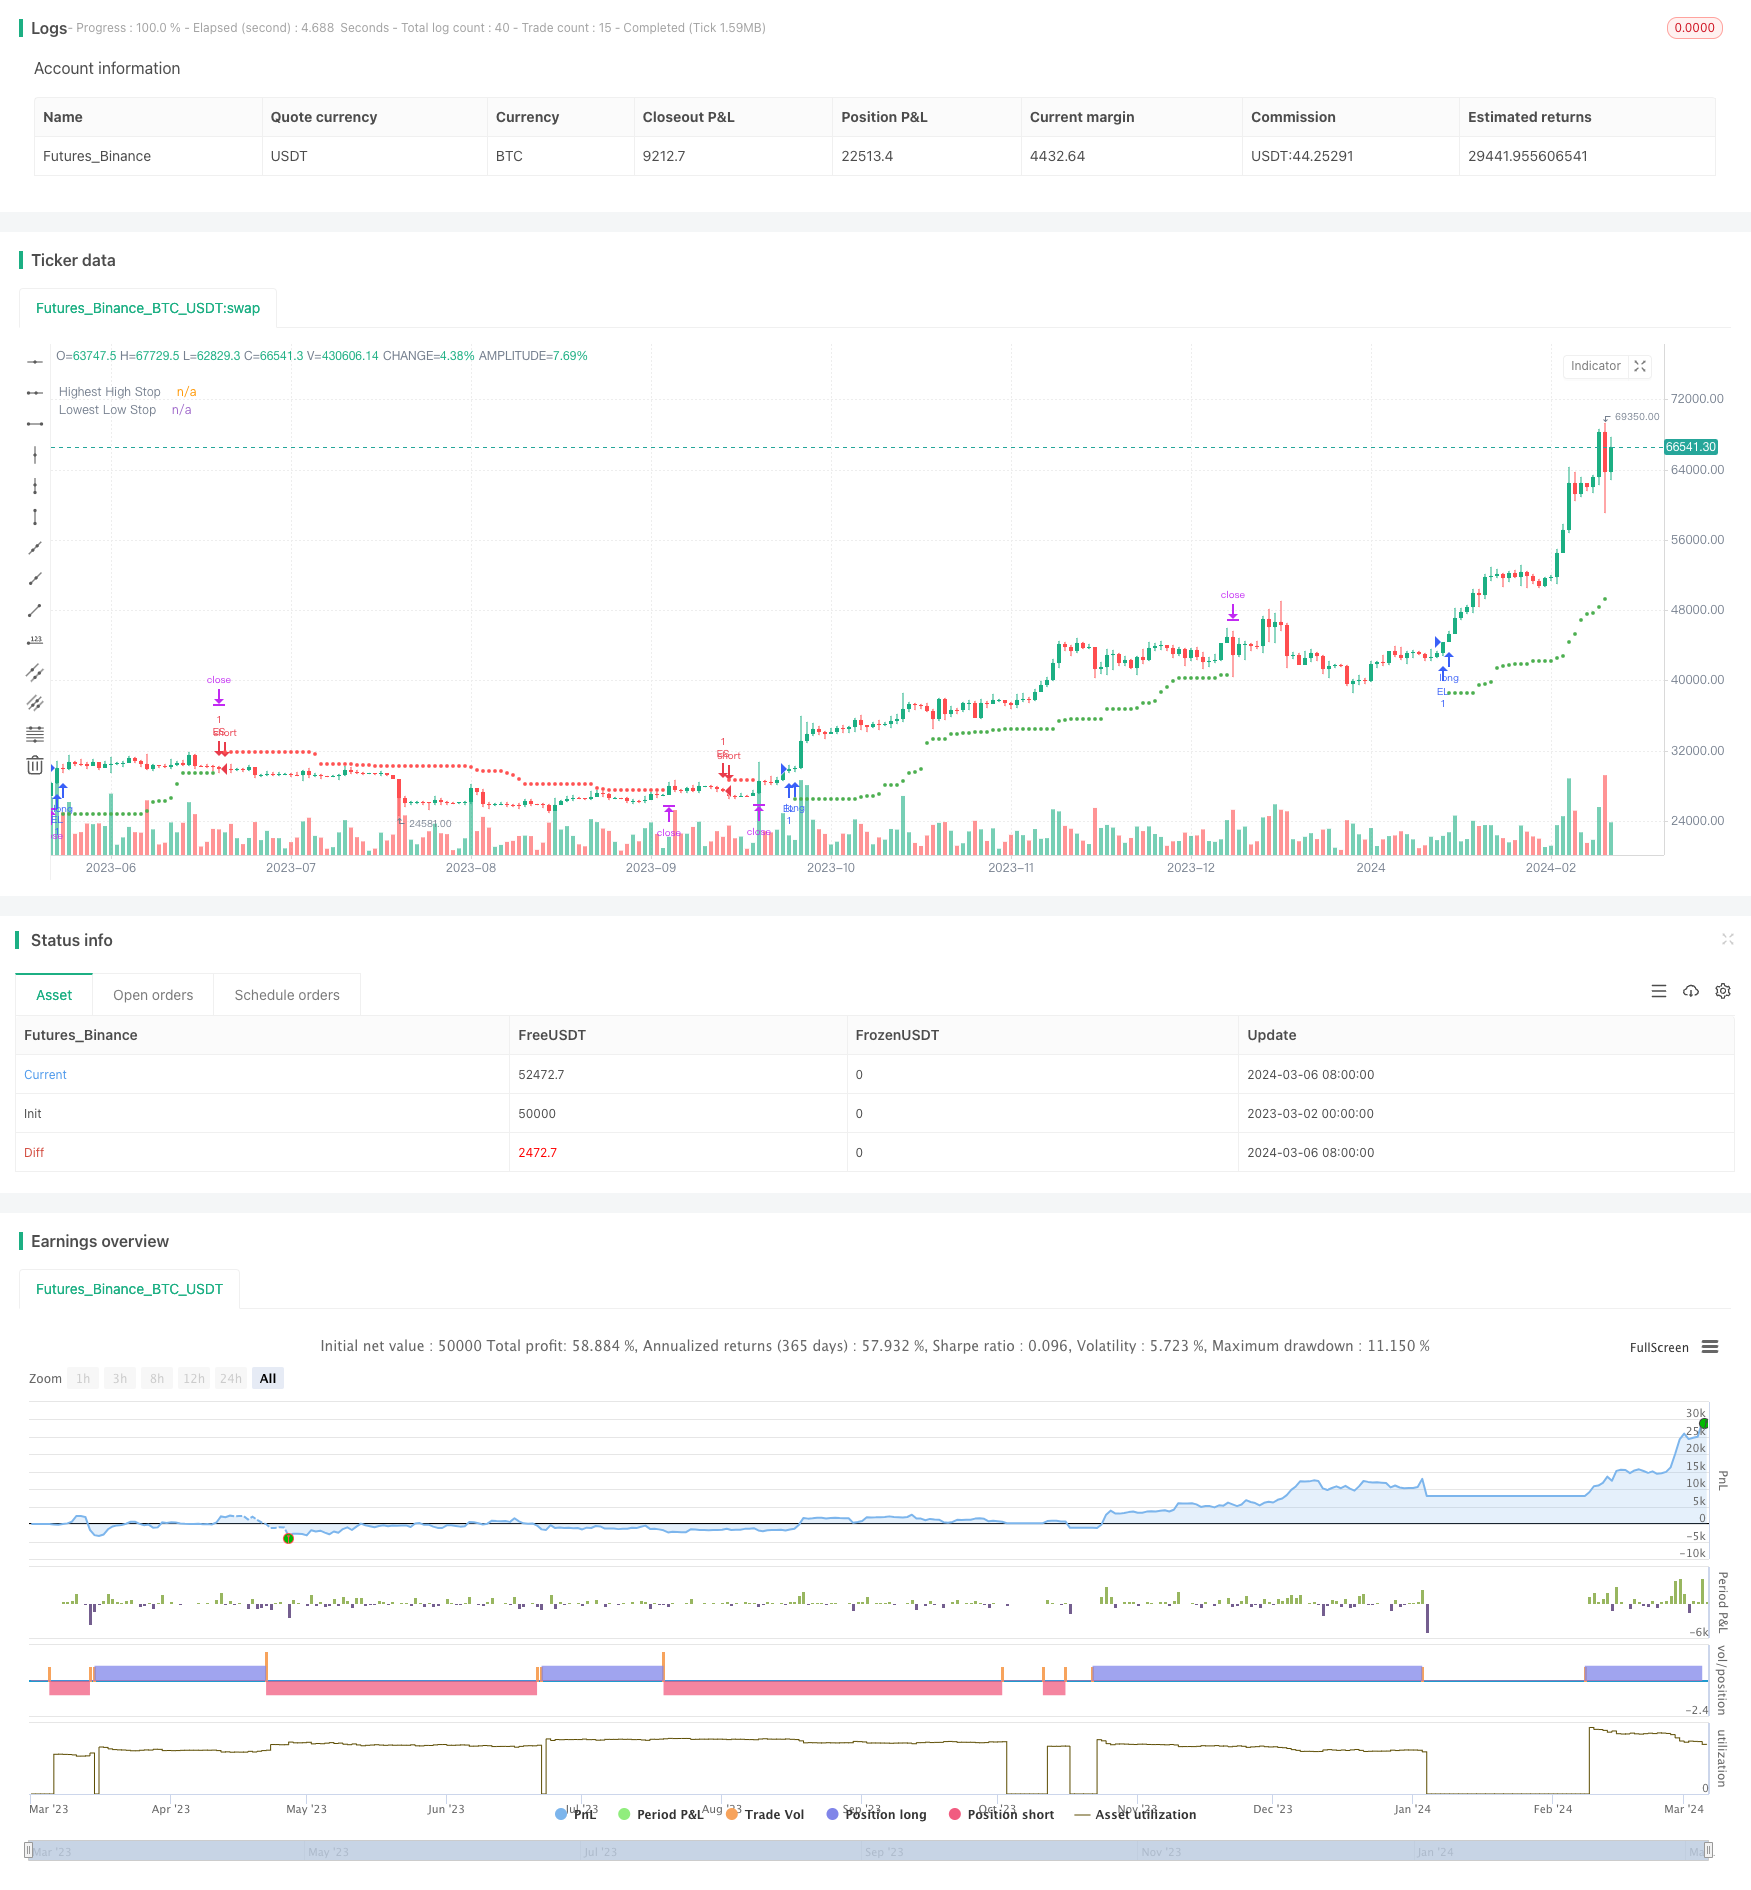
/*backtest
start: 2023-03-02 00:00:00
end: 2024-03-07 00:00:00
period: 1d
basePeriod: 1h
exchanges: [{"eid":"Futures_Binance","currency":"BTC_USDT"}]
*/

//@version=5
strategy(title="Highest high/lowest low stop", overlay=true)

// STEP 1:
// Make inputs for length of highest high and lowest low
hiLen = input.int(20, title="Highest High Lookback", minval=2)
loLen = input.int(20, title="Lowest Low Lookback", minval=2)

// STEP 2:
// Calculate recent extreme high and low
hiHighs = ta.highest(high, hiLen)[1]
loLows  = ta.lowest(low, loLen)[1]

// Plot stop values for visual confirmation
plot(strategy.position_size > 0 ? loLows : na,
     style=plot.style_circles, color=color.green, linewidth=3,
     title="Lowest Low Stop")

plot(strategy.position_size < 0 ? hiHighs : na,
     style=plot.style_circles, color=color.red, linewidth=3,
     title="Highest High Stop")

// Trading conditions for this example strategy
higherCloses = close > close[1] and
     close[1] > close[2] and
     close[2] > close[3]

lowerCloses = close < close[1] and
     close[1] < close[2] and
     close[2] < close[3]

isFlat = strategy.position_size == 0

// Submit entry orders
if isFlat and higherCloses
    strategy.entry("EL", strategy.long)

if isFlat and lowerCloses
    strategy.entry("ES", strategy.short)

// STEP 3:
// Submit stops based on highest high and lowest low
if strategy.position_size > 0
    strategy.exit("XL HH", stop=loLows)

if strategy.position_size < 0
    strategy.exit("XS LL", stop=hiHighs)