Overview
This strategy identifies the high and low points at 9:15 in the morning session, automatically calculates the target prices and stop-loss prices for long and short positions, and automatically opens positions when conditions are met. The strategy uses the Relative Strength Index (RSI) to determine overbought and oversold states, combined with breakouts of the 9:15 high and low points to determine entry opportunities.
Strategy Principles
- Determine the high and low point formation interval from 9:00 to 9:15.
- Record the highest price and lowest price at 9:15 as sessionHigh and sessionLow, respectively.
- Calculate the long target price (sessionHigh+200), short target price (sessionLow-200), and corresponding stop-loss prices.
- Obtain the current closing price and RSI indicator.
- Long entry condition: closing price breaks above sessionHigh and RSI is greater than the overbought level.
- Short entry condition: closing price breaks below sessionLow and RSI is less than the oversold level.
- Plot relevant price levels and automatically open long or short positions based on entry conditions.
Advantages Analysis
- Simple and easy to use: The strategy is based on clear 9:15 high/low points and RSI indicator, with a clear logic that is easy to understand and implement.
- High degree of automation: The strategy includes built-in calculations for target prices and stop-loss prices, as well as entry condition judgments, allowing for automatic trade execution.
- Timely stop-loss: Stop-loss prices are set based on the 9:15 high/low points, providing a clear stop-loss level once a position is opened, effectively controlling risk.
- Trend tracking: By using the RSI indicator to judge overbought and oversold conditions, the strategy enters at the beginning of trend formation, helping to follow the trend.
Risk Analysis
- Parameter optimization risk: Strategy parameters such as RSI length and overbought/oversold thresholds need to be optimized based on market characteristics, and different parameters may lead to different results.
- Single indicator risk: The strategy relies mainly on the RSI indicator, which may become ineffective in certain market conditions.
- Intraday volatility risk: Price fluctuations after 9:15 may trigger stop-losses and miss trending moves.
- Lack of position management: The strategy lacks control over position sizing and money management, and overly frequent position opening may bring additional risks.
Optimization Directions
- Dynamic stop-loss: Dynamically adjust stop-loss levels based on price volatility or indicators such as Average True Range (ATR) to track price changes.
- Combine with other indicators: Introduce other indicators such as MACD and moving average systems to confirm trend judgments and improve entry accuracy.
- Optimize entry conditions: Adaptively adjust RSI overbought/oversold thresholds to avoid limitations of fixed thresholds.
- Introduce position management: Control position sizing based on market volatility conditions, such as using percentage risk models.
Summary
This strategy is based on the 9:15 high/low points, uses the RSI indicator for trend judgment, automatically calculates target prices and stop-loss prices, and automatically opens long or short positions based on entry conditions. The strategy logic is simple and clear, with a high degree of automation, allowing for quick capture of trending moves. However, the strategy also has risks in terms of parameter optimization, reliance on a single indicator, intraday volatility, and lack of position management. In the future, the strategy can be optimized and improved in aspects such as dynamic stop-loss, combining with other indicators, optimizing entry conditions, and introducing position management, in order to obtain more robust trading performance.
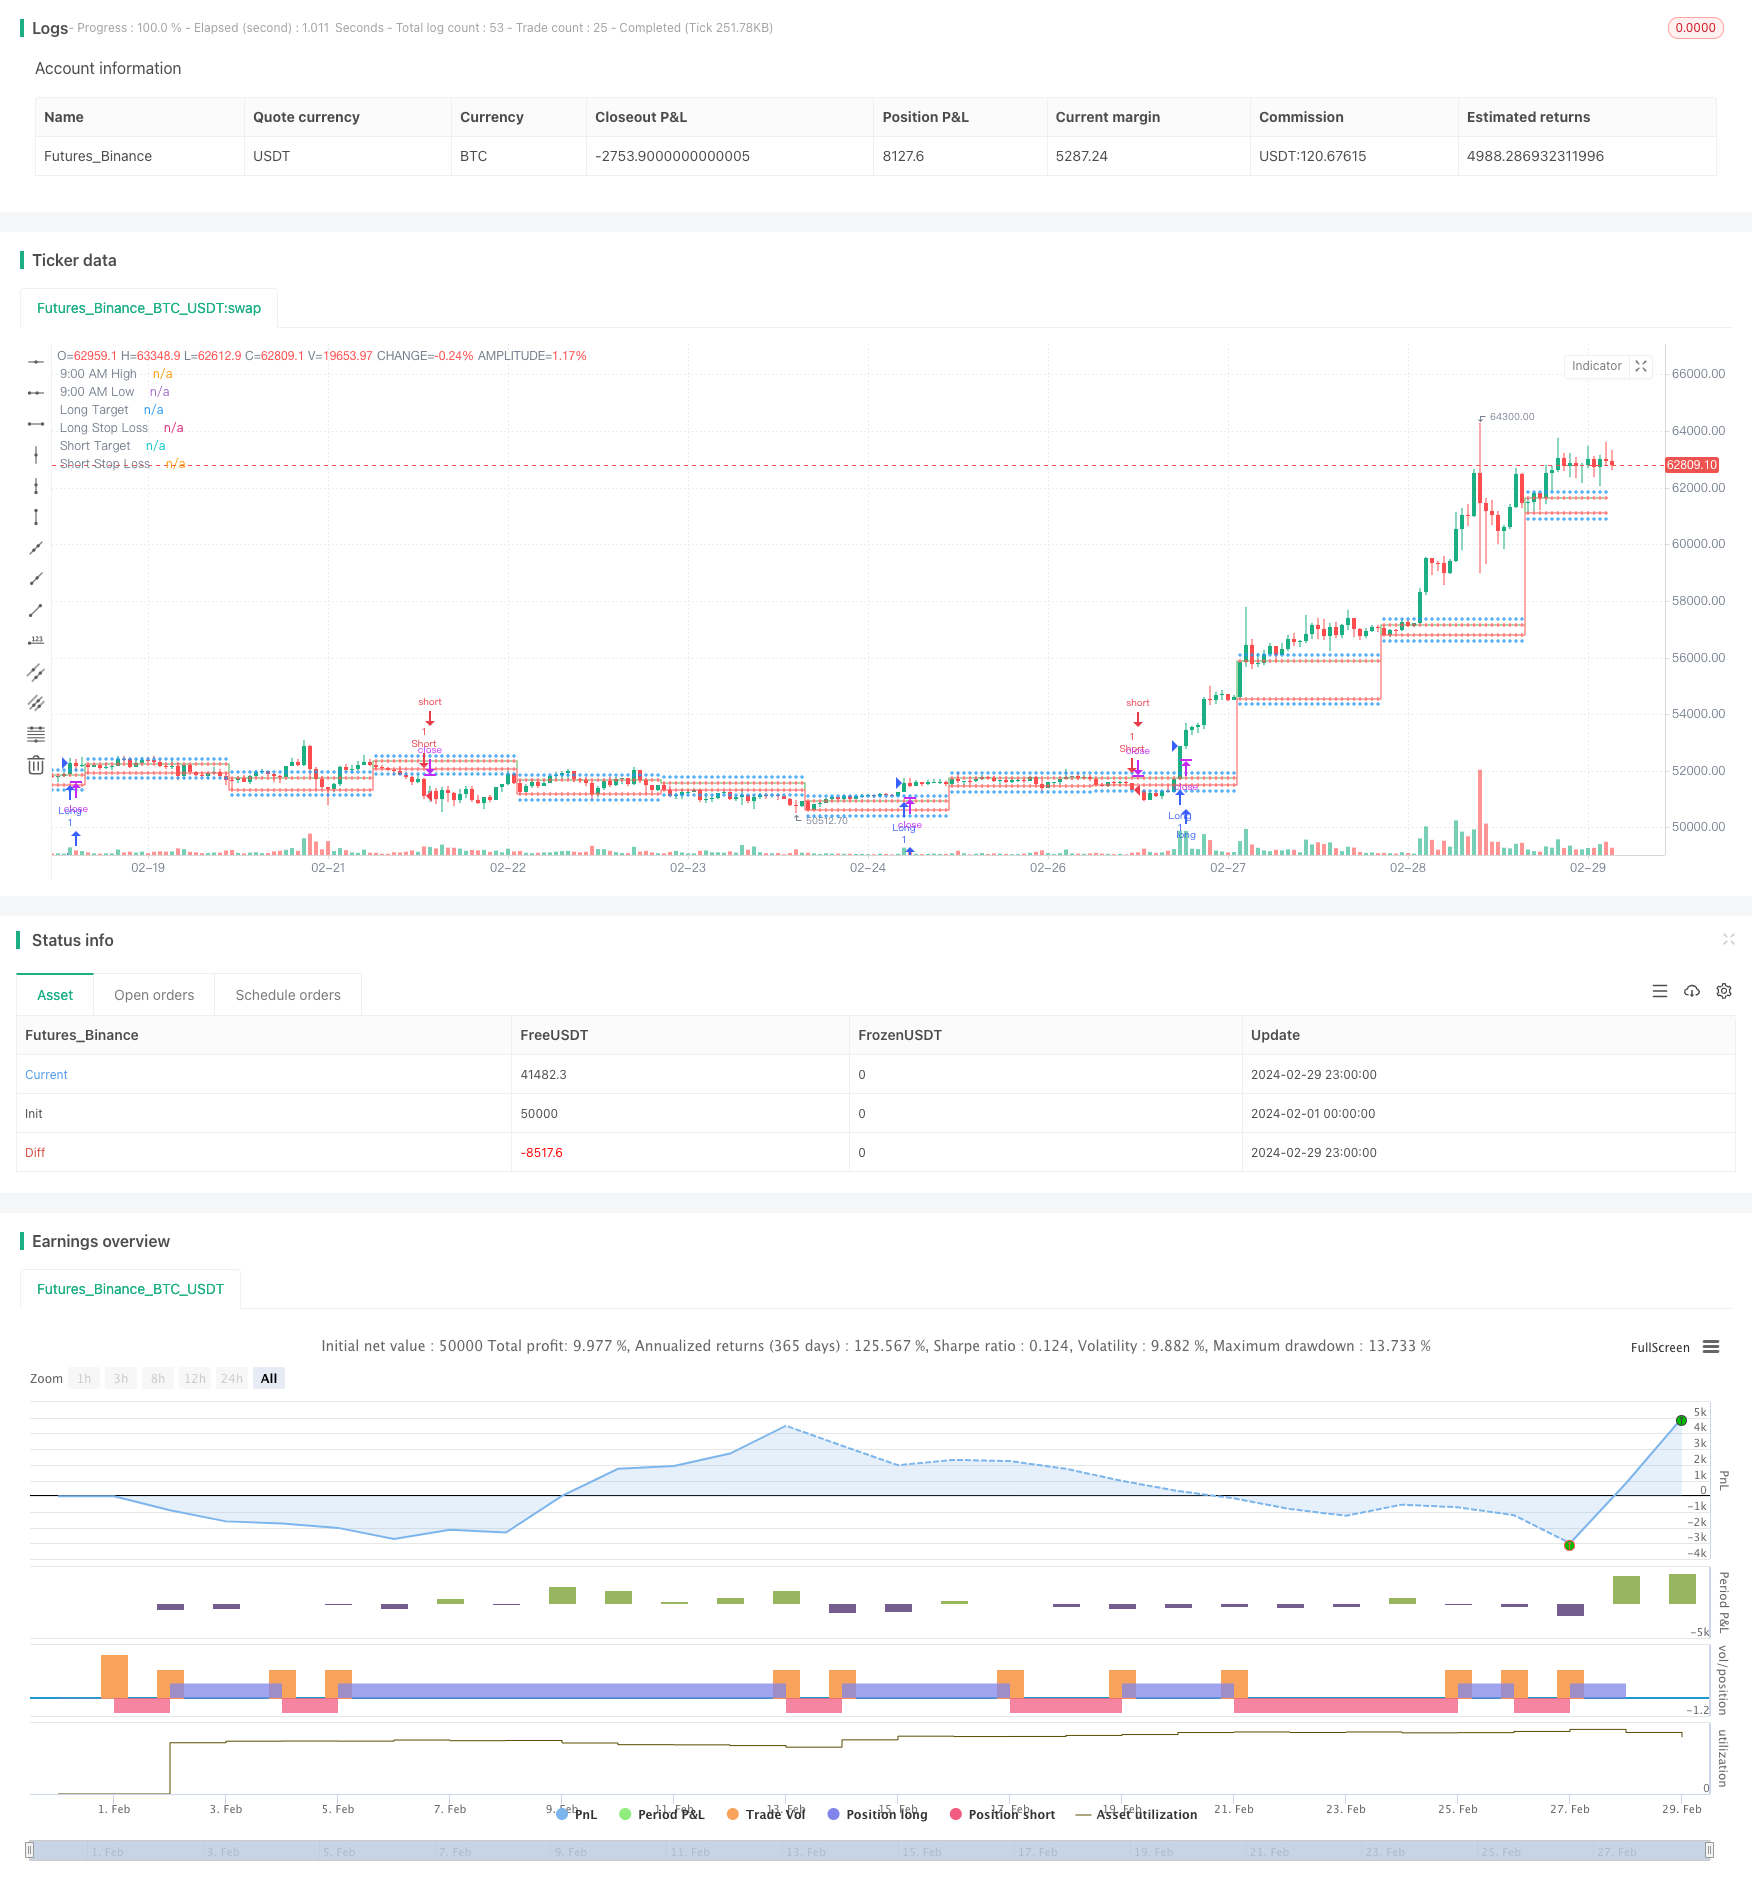
/*backtest
start: 2024-02-01 00:00:00
end: 2024-02-29 23:59:59
period: 1h
basePeriod: 15m
exchanges: [{"eid":"Futures_Binance","currency":"BTC_USDT"}]
*/

//@version=5
strategy("9:15 AM High/Low with Automatic Forecasting", overlay=true)

// Parameters
showSignals = input(true, title="Show Signals")

// Define session time
sessionStartHour = input(9, title="Session Start Hour")
sessionStartMinute = input(0, title="Session Start Minute")
sessionEndHour = input(9, title="Session End Hour")
sessionEndMinute = input(15, title="Session End Minute")

// Calculate session high and low
var float sessionHigh = na
var float sessionLow = na
if (hour == sessionStartHour and minute == sessionStartMinute)
    sessionHigh := high
    sessionLow := low

// Update session high and low if within session time
if (hour == sessionStartHour and minute >= sessionStartMinute and minute < sessionEndMinute)
    sessionHigh := high > sessionHigh or na(sessionHigh) ? high : sessionHigh
    sessionLow := low < sessionLow or na(sessionLow) ? low : sessionLow

// Plot horizontal lines for session high and low
plot(sessionHigh, color=color.green, title="9:00 AM High", style=plot.style_stepline, linewidth=1)
plot(sessionLow, color=color.red, title="9:00 AM Low", style=plot.style_stepline, linewidth=1)

// Calculate targets and stop loss
longTarget = sessionHigh + 200
longStopLoss = sessionLow
shortTarget = sessionLow - 200
shortStopLoss = sessionHigh

// Plot targets and stop loss
plot(longTarget, color=color.blue, title="Long Target", style=plot.style_cross, linewidth=1)
plot(longStopLoss, color=color.red, title="Long Stop Loss", style=plot.style_cross, linewidth=1)
plot(shortTarget, color=color.blue, title="Short Target", style=plot.style_cross, linewidth=1)
plot(shortStopLoss, color=color.red, title="Short Stop Loss", style=plot.style_cross, linewidth=1)

// RSI
rsiLength = input(14, title="RSI Length")
overboughtLevel = input(60, title="Overbought Level")
oversoldLevel = input(40, title="Oversold Level")
rsi = ta.rsi(close, rsiLength)

// Entry conditions
longCondition = close > sessionHigh and rsi > overboughtLevel
shortCondition = close < sessionLow and rsi < oversoldLevel

// Long entry
if (showSignals and longCondition)
    strategy.entry("Long", strategy.long)

// Short entry
if (showSignals and shortCondition)
    strategy.entry("Short", strategy.short)