Strategy Overview
The Kuberan strategy is a powerful trading strategy developed by Kathir. It combines multiple analytical techniques to form a unique and potent trading approach. Named after the god of wealth, Kuberan, the strategy symbolizes its goal of enriching traders’ portfolios.
Kuberan is more than just a strategy; it is a comprehensive trading system. It integrates trend analysis, momentum indicators, and volume metrics to identify high-probability trading opportunities. By leveraging the synergy of these elements, Kuberan provides clear entry and exit signals, suitable for traders of all levels.
Strategy Principles
At the core of the Kuberan strategy is the principle of multi-indicator confluence. It utilizes a unique combination of indicators that work in harmony to reduce noise and false signals. Specifically, the strategy employs the following key components:
- Trend direction determination: By comparing current prices with support and resistance levels, it determines the prevailing trend direction.
- Support and resistance levels: Identifies key support and resistance levels using the zigzag indicator and pivot points.
- Divergence detection: Compares price action with momentum indicators to spot potential trend reversals signaled by divergences.
- Volatility adaptation: Dynamically adjusts stop-loss levels based on the ATR indicator to adapt to varying market volatility.
- Candlestick pattern recognition: Confirms trend and reversal signals using specific candlestick combinations.
By comprehensively considering these factors, the Kuberan strategy can adaptively adjust to various market conditions and capture high-probability trading opportunities.
Strategy Advantages
- Multi-indicator confluence: Kuberan leverages the synergy of multiple indicators, greatly enhancing signal reliability and reducing noise interference.
- High adaptability: Through dynamic parameter adjustments, the strategy can adapt to changing market environments, avoiding obsolescence.
- Clear signals: Kuberan provides clear entry and exit signals, simplifying the trading decision process.
- Robust backtesting: The strategy has undergone rigorous historical backtesting, demonstrating consistent performance across various market scenarios.
- Wide applicability: Kuberan is applicable to multiple markets and instruments, not limited to specific trading vehicles.
Strategy Risks
- Parameter sensitivity: The performance of the Kuberan strategy is sensitive to parameter selection; inappropriate parameters may lead to suboptimal results.
- Black swan events: The strategy primarily relies on technical signals and has limited ability to handle fundamental black swan events.
- Overfitting risk: If too much historical data is considered during parameter optimization, the strategy may become overly fitted to the past, reducing its adaptability to future market conditions.
- Leverage risk: Using excessive leverage poses the risk of margin calls during significant drawdowns.
To mitigate these risks, appropriate control measures can be implemented, such as periodic parameter adjustments, setting reasonable stop-losses, moderating leverage, and monitoring fundamental changes.
Optimization Directions
- Machine learning optimization: Introduce machine learning algorithms to dynamically optimize strategy parameters and enhance adaptability.
- Incorporation of fundamental factors: Consider integrating fundamental analysis into trading decisions to handle situations where technical signals fail.
- Portfolio management: At the capital management level, include the Kuberan strategy in a diversified portfolio to achieve effective hedging with other strategies.
- Market-specific optimization: Customize strategy parameters based on the characteristics of different markets and instruments.
- High-frequency transformation: Adapt the strategy into a high-frequency trading version to capture more short-term trading opportunities.
Conclusion
Kuberan is a powerful and reliable trading strategy that ingeniously combines multiple technical analysis methods. Through the principle of indicator confluence, it excels in capturing trends and identifying turning points. While no strategy is immune to risks, Kuberan has proven its robustness in backtesting. With appropriate risk control measures and optimization efforts, this strategy can help traders gain an edge in market battles, driving long-term, steady growth of their investment portfolios.
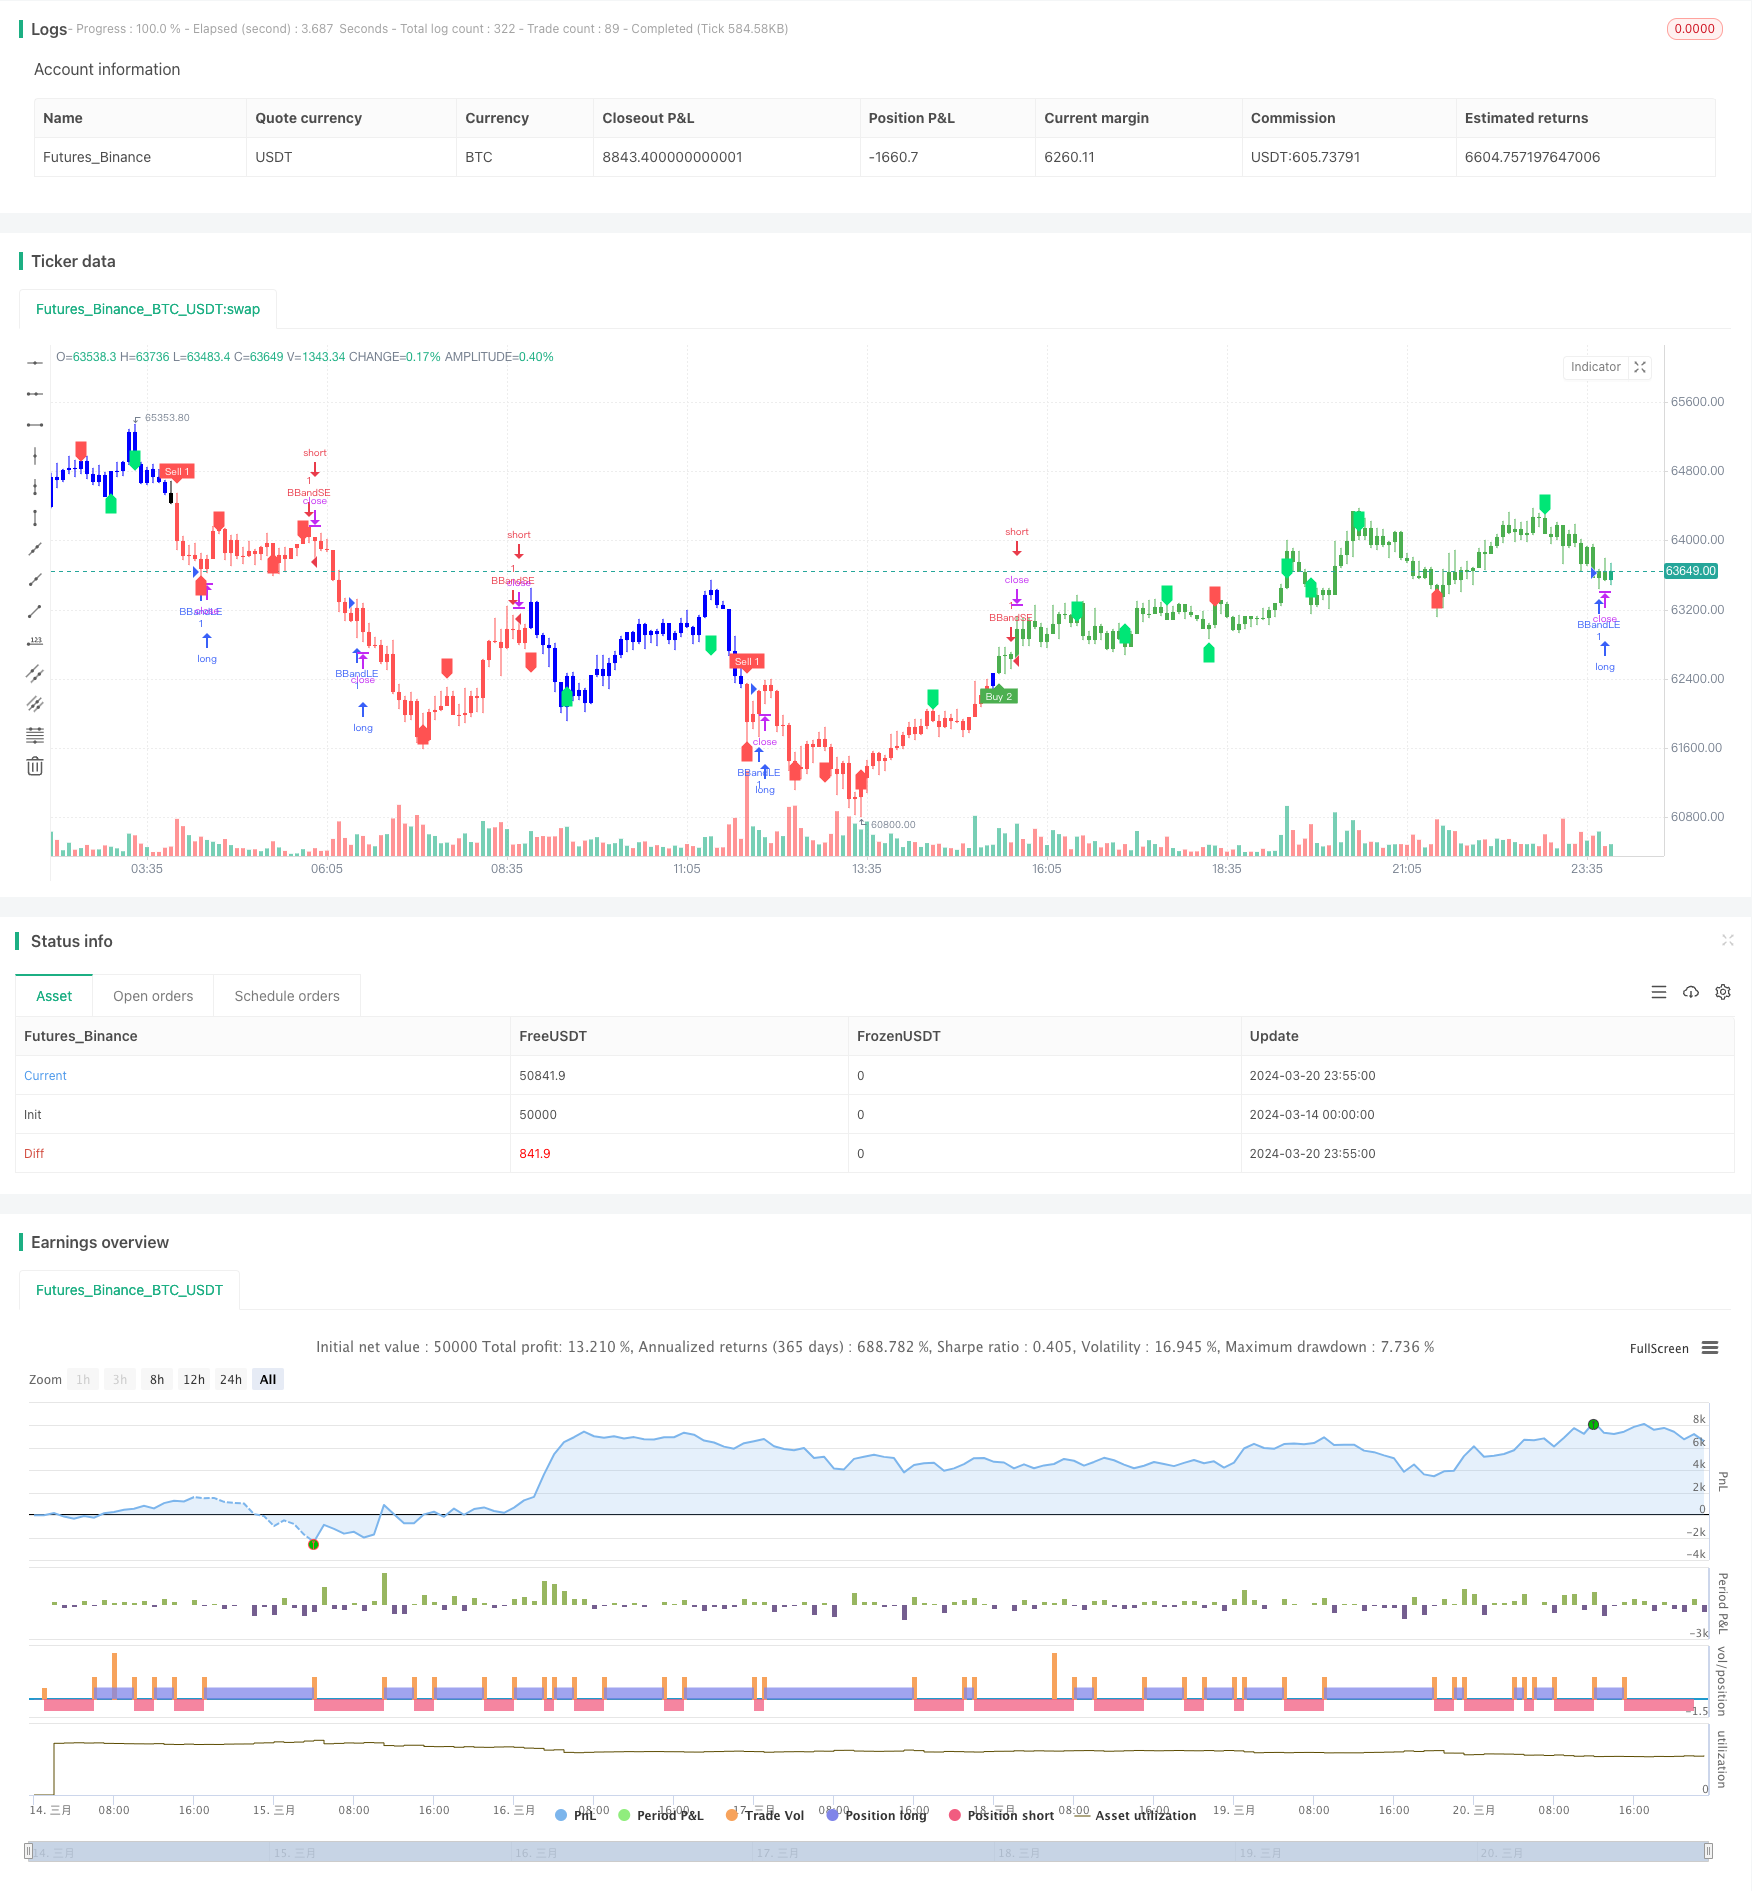
/*backtest
start: 2024-03-14 00:00:00
end: 2024-03-21 00:00:00
period: 5m
basePeriod: 1m
exchanges: [{"eid":"Futures_Binance","currency":"BTC_USDT"}]
*/

// This source code is subject to the terms of the Mozilla Public License 2.0 at https://mozilla.org/MPL/2.0/
// © LonesomeThecolor.blue
// This source code is subject to the terms of the Mozilla Public License 2.0 at https://mozilla.org/MPL/2.0/
// © LonesomeThecolor.blue

//@version=5
strategy('Kuberan*', overlay=true, max_lines_count=500)
lb = input.int(5, title='Left Bars', minval=1)
rb = input.int(5, title='Right Bars', minval=1)
showsupres = input.bool(false, title='Support/Resistance', inline='srcol')
supcol = input.color(color.lime, title='', inline='srcol')
rescol = input.color(color.red, title='', inline='srcol')
// srlinestyle = input(line.style_dotted, title='Line Style/Width', inline='style')
srlinewidth = input.int(3, title='', minval=1, maxval=5, inline='style')
changebarcol = input.bool(true, title='Change Bar Color', inline='bcol')
bcolup = input.color(color.blue, title='', inline='bcol')
bcoldn = input.color(color.black, title='', inline='bcol')

ph = ta.pivothigh(lb, rb)
pl = ta.pivotlow(lb, rb)

iff_1 = pl ? -1 : na  // Trend direction
hl = ph ? 1 : iff_1
iff_2 = pl ? pl : na  // similar to zigzag but may have multTLiple highs/lows
zz = ph ? ph : iff_2
valuewhen_1 = ta.valuewhen(hl, hl, 1)
valuewhen_2 = ta.valuewhen(zz, zz, 1)
zz := pl and hl == -1 and valuewhen_1 == -1 and pl > valuewhen_2 ? na : zz
valuewhen_3 = ta.valuewhen(hl, hl, 1)
valuewhen_4 = ta.valuewhen(zz, zz, 1)
zz := ph and hl == 1 and valuewhen_3 == 1 and ph < valuewhen_4 ? na : zz

valuewhen_5 = ta.valuewhen(hl, hl, 1)
valuewhen_6 = ta.valuewhen(zz, zz, 1)
hl := hl == -1 and valuewhen_5 == 1 and zz > valuewhen_6 ? na : hl
valuewhen_7 = ta.valuewhen(hl, hl, 1)
valuewhen_8 = ta.valuewhen(zz, zz, 1)
hl := hl == 1 and valuewhen_7 == -1 and zz < valuewhen_8 ? na : hl
zz := na(hl) ? na : zz

findprevious() =>  // finds previous three points (b, c, d, e)
    ehl = hl == 1 ? -1 : 1
    loc1 = 0.0
    loc2 = 0.0
    loc3 = 0.0
    loc4 = 0.0
    xx = 0
    for x = 1 to 1000 by 1
        if hl[x] == ehl and not na(zz[x])
            loc1 := zz[x]
            xx := x + 1
            break
    ehl := hl
    for x = xx to 1000 by 1
        if hl[x] == ehl and not na(zz[x])
            loc2 := zz[x]
            xx := x + 1
            break
    ehl := hl == 1 ? -1 : 1
    for x = xx to 1000 by 1
        if hl[x] == ehl and not na(zz[x])
            loc3 := zz[x]
            xx := x + 1
            break
    ehl := hl
    for x = xx to 1000 by 1
        if hl[x] == ehl and not na(zz[x])
            loc4 := zz[x]
            break
    [loc1, loc2, loc3, loc4]

float a = na
float b = na
float c = na
float d = na
float e = na
if not na(hl)
    [loc1, loc2, loc3, loc4] = findprevious()
    a := zz
    b := loc1
    c := loc2
    d := loc3
    e := loc4
    e

_hh = zz and a > b and a > c and c > b and c > d
_ll = zz and a < b and a < c and c < b and c < d
_hl = zz and (a >= c and b > c and b > d and d > c and d > e or a < b and a > c and b < d)
_lh = zz and (a <= c and b < c and b < d and d < c and d < e or a > b and a < c and b > d)

plotshape(_hl, title='Higher Low', style=shape.labelup, color=color.new(color.lime, 0), textcolor=color.new(color.black, 0), location=location.belowbar, offset=-rb)
plotshape(_hh, title='Higher High', style=shape.labeldown, color=color.new(color.lime, 0), textcolor=color.new(color.black, 0), location=location.abovebar, offset=-rb)
plotshape(_ll, title='Lower Low', style=shape.labelup, color=color.new(color.red, 0), textcolor=color.new(color.white, 0), location=location.belowbar, offset=-rb)
plotshape(_lh, title='Lower High', style=shape.labeldown, color=color.new(color.red, 0), textcolor=color.new(color.white, 0), location=location.abovebar, offset=-rb)

float res = na
float sup = na
res := _lh ? zz : res[1]
sup := _hl ? zz : sup[1]

int trend = na
iff_3 = close < sup ? -1 : nz(trend[1])
trend := close > res ? 1 : iff_3

res := trend == 1 and _hh or trend == -1 and _lh ? zz : res
sup := trend == 1 and _hl or trend == -1 and _ll ? zz : sup
rechange = res != res[1]
suchange = sup != sup[1]

var line resline = na
var line supline = na
if showsupres
    if rechange
        line.set_x2(resline, bar_index)
        line.set_extend(resline, extend=extend.none)
        resline := line.new(x1=bar_index - rb, y1=res, x2=bar_index, y2=res, color=rescol, extend=extend.right, style=line.style_dotted, width=srlinewidth)
        resline

    if suchange
        line.set_x2(supline, bar_index)
        line.set_extend(supline, extend=extend.none)
        supline := line.new(x1=bar_index - rb, y1=sup, x2=bar_index, y2=sup, color=supcol, extend=extend.right, style=line.style_dotted, width=srlinewidth)
        supline

iff_4 = trend == 1 ? bcolup : bcoldn
barcolor(color=changebarcol ? iff_4 : na)


// Inputs
A1 = input(5, title='Key Value. \'This changes the sensitivity\' for sell1')
C1 = input(400, title='ATR Period for sell1')
A2 = input(6, title='Key Value. \'This changes the sensitivity\' for buy2')
C2 = input(1, title='ATR Period for buy2')
h = input(false, title='Signals from Heikin Ashi Candles')

xATR1 = ta.atr(C1)
xATR2 = ta.atr(C2)
nLoss1 = A1 * xATR1
nLoss2 = A2 * xATR2

src = h ? request.security(ticker.heikinashi(syminfo.tickerid), timeframe.period, close, lookahead=barmerge.lookahead_off) : close

xATRTrailingStop1 = 0.0
iff_5 = src > nz(xATRTrailingStop1[1], 0) ? src - nLoss1 : src + nLoss1
iff_6 = src < nz(xATRTrailingStop1[1], 0) and src[1] < nz(xATRTrailingStop1[1], 0) ? math.min(nz(xATRTrailingStop1[1]), src + nLoss1) : iff_5
xATRTrailingStop1 := src > nz(xATRTrailingStop1[1], 0) and src[1] > nz(xATRTrailingStop1[1], 0) ? math.max(nz(xATRTrailingStop1[1]), src - nLoss1) : iff_6

xATRTrailingStop2 = 0.0
iff_7 = src > nz(xATRTrailingStop2[1], 0) ? src - nLoss2 : src + nLoss2
iff_8 = src < nz(xATRTrailingStop2[1], 0) and src[1] < nz(xATRTrailingStop2[1], 0) ? math.min(nz(xATRTrailingStop2[1]), src + nLoss2) : iff_7
xATRTrailingStop2 := src > nz(xATRTrailingStop2[1], 0) and src[1] > nz(xATRTrailingStop2[1], 0) ? math.max(nz(xATRTrailingStop2[1]), src - nLoss2) : iff_8

pos1 = 0
iff_9 = src[1] > nz(xATRTrailingStop1[1], 0) and src < nz(xATRTrailingStop1[1], 0) ? -1 : nz(pos1[1], 0)
pos1 := src[1] < nz(xATRTrailingStop1[1], 0) and src > nz(xATRTrailingStop1[1], 0) ? 1 : iff_9

pos2 = 0
iff_10 = src[1] > nz(xATRTrailingStop2[1], 0) and src < nz(xATRTrailingStop2[1], 0) ? -1 : nz(pos2[1], 0)
pos2 := src[1] < nz(xATRTrailingStop2[1], 0) and src > nz(xATRTrailingStop2[1], 0) ? 1 : iff_10

xcolor1 = pos1 == -1 ? color.red : pos1 == 1 ? color.green : color.blue
xcolor2 = pos2 == -1 ? color.red : pos2 == 1 ? color.green : color.blue

ema1 = ta.ema(src, 1)
ema2 = ta.ema(src, 1)
above1 = ta.crossover(ema1, xATRTrailingStop1)
below1 = ta.crossover(xATRTrailingStop1, ema1)
above2 = ta.crossover(ema2, xATRTrailingStop2)
below2 = ta.crossover(xATRTrailingStop2, ema2)

buy1 = src > xATRTrailingStop1 and above1
sell1 = src < xATRTrailingStop1 and below1
buy2 = src > xATRTrailingStop2 and above2
sell2 = src < xATRTrailingStop2 and below2

barbuy1 = src > xATRTrailingStop1
barsell1 = src < xATRTrailingStop1
barbuy2 = src > xATRTrailingStop2
barsell2 = src < xATRTrailingStop2

// plotshape(buy1, title="Buy 1", text='Buy 1', style=shape.labelup, location=location.belowbar, color=color.green, textcolor=color.white, transp=0, size=size.tiny)
plotshape(sell1, title='Sell 1', text='Sell 1', style=shape.labeldown, location=location.abovebar, color=color.new(color.red, 0), textcolor=color.new(color.white, 0), size=size.tiny)
plotshape(buy2, title='Buy 2', text='Buy 2', style=shape.labelup, location=location.belowbar, color=color.new(color.green, 0), textcolor=color.new(color.white, 0), size=size.tiny)
// plotshape(sell2, title="Sell 2", text='Sell 2', style=shape.labeldown, location=location.abovebar, color=color.red, textcolor=color.white, transp=0, size=size.tiny)

// barcolor(barbuy1 ? color.green : na)
barcolor(barsell1 ? color.red : na)
barcolor(barbuy2 ? color.green : na)
// barcolor(barsell2 ? color.red : na)

// alertcondition(buy1, "UT Long 1", "UT Long 1")
alertcondition(sell1, 'UT Short 1', 'UT Short 1')
alertcondition(buy2, 'UT Long 2', 'UT Long 2')

// strategy.entry('long', strategy.long, when=buy2)
source = close
length = input.int(20, minval=1)
mult = input.float(2.0, minval=0.001, maxval=50)
basis = ta.sma(source, length)
dev = mult * ta.stdev(source, length)
upper = basis + dev
lower = basis - dev
buyEntry = ta.crossover(source, lower)
sellEntry = ta.crossunder(source, upper)
if (ta.crossover(source, lower) )
	strategy.entry("BBandLE", strategy.long, stop=lower, oca_name="BollingerBands",  comment="BBandLE")
else
	strategy.cancel(id="BBandLE")
if (ta.crossunder(source, upper))
	strategy.entry("BBandSE", strategy.short, stop=upper, oca_name="BollingerBands",comment="BBandSE")
else
	strategy.cancel(id="BBandSE")
//plot(strategy.equity, title="equity", color=color.red, linewidth=2, style=plot.style_areabr)

lengthTL = input.int(14, 'Swing Detection Lookback')
multTL = input.float(1., 'Slope', minval = 0, step = .1)
calcMethod = input.string('Atr', 'Slope Calculation Method', options = ['Atr','Stdev','Linreg'])
backpaint = input(true, tooltip = 'Backpainting offset displayed elements in the past. Disable backpainting to see real time information returned by the indicator.')

//Style
upCss = input.color(color.teal, 'Up Trendline Color', group = 'Style')
dnCss = input.color(color.red, 'Down Trendline Color', group = 'Style')
showExt = input(true, 'Show Extended Lines')

//-----------------------------------------------------------------------------}
//Calculations
//-----------------------------------------------------------------------------{
var upperTL = 0.
var lowerTL = 0.
var slope_phTL = 0.
var slope_plTL = 0.

var offset = backpaint ? lengthTL : 0

n = bar_index
srcTL = close

phTL = ta.pivothigh(lengthTL, lengthTL)
plTL = ta.pivotlow(lengthTL, lengthTL)

//Slope Calculation Method
slope = switch calcMethod
    'Atr'    => ta.atr(lengthTL) / lengthTL * multTL
    'Stdev'  => ta.stdev(srcTL,lengthTL) / lengthTL * multTL
    'Linreg' => math.abs(ta.sma(srcTL * n, lengthTL) - ta.sma(srcTL, lengthTL) * ta.sma(n, lengthTL)) / ta.variance(n, lengthTL) / 2 * multTL

//Get slopes and calculate trendlines
slope_phTL := phTL ? slope : slope_phTL
slope_plTL := plTL ? slope : slope_plTL

upperTL := phTL ? phTL : upperTL - slope_phTL
lowerTL := pl ? pl : lowerTL + slope_plTL

var upos = 0
var dnos = 0
upos := phTL ? 0 : close > upperTL - slope_phTL * lengthTL ? 1 : upos
dnos := pl ? 0 : close < lowerTL + slope_plTL * lengthTL ? 1 : dnos