EMA Double Moving Average Crossover Strategy

Overview
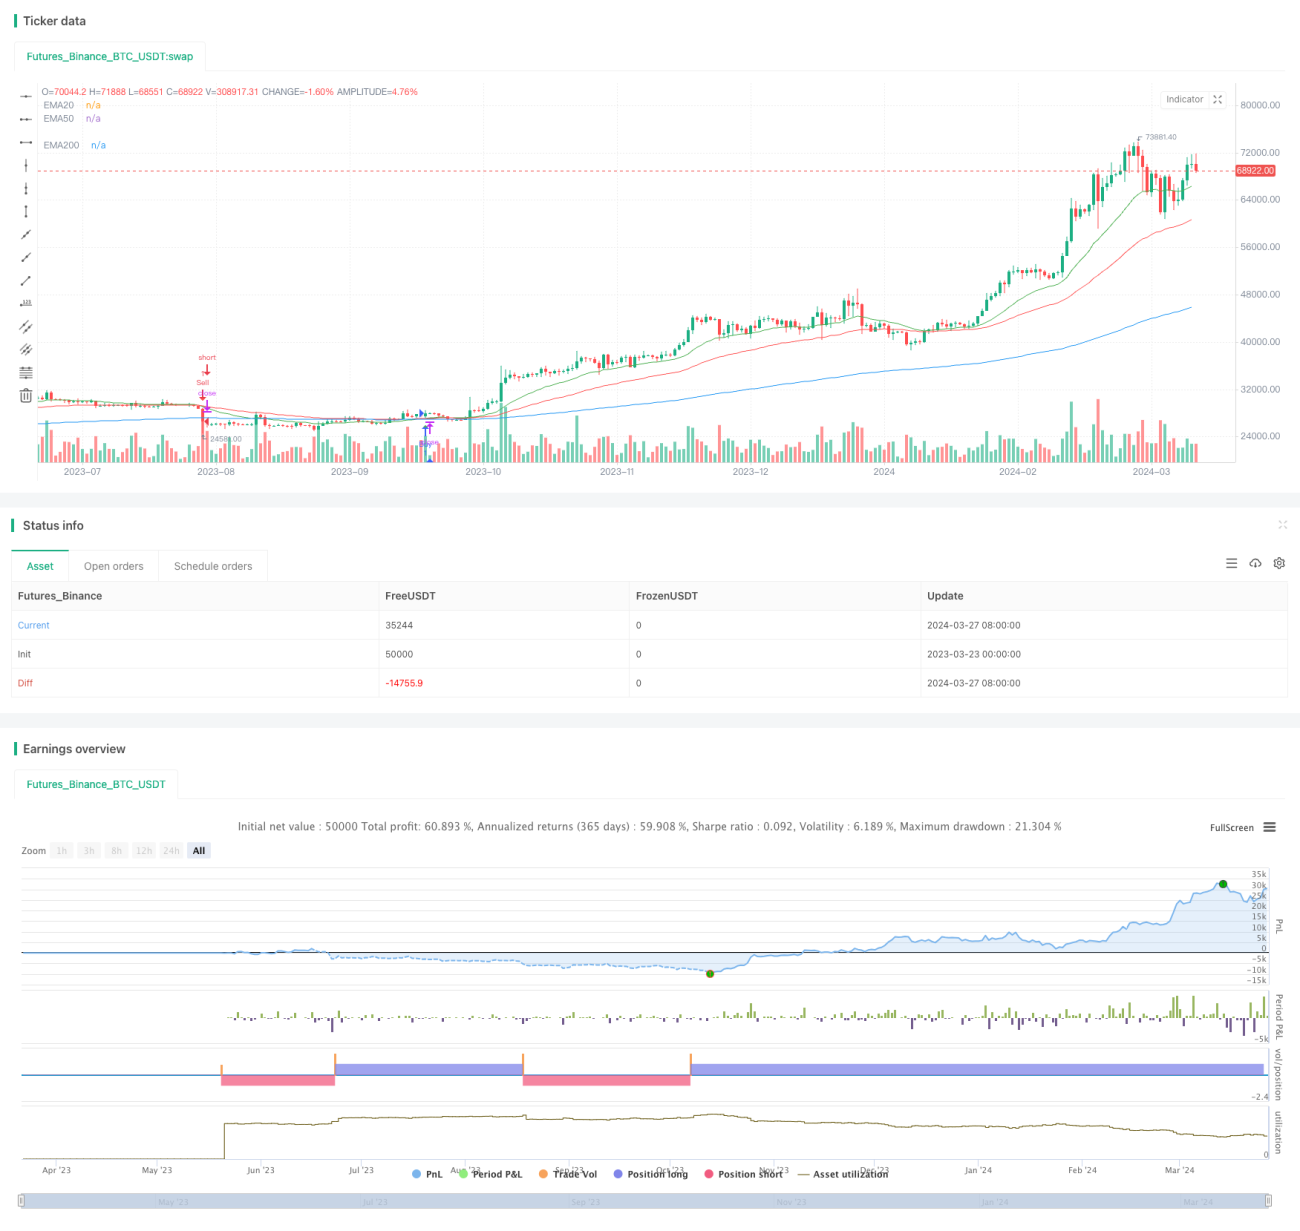
This strategy generates trading signals based on the crossover of two moving averages (EMA). When the short-term EMA (20-day) crosses above the long-term EMA (50-day), a buy signal is triggered; when the short-term EMA crosses below the long-term EMA, a sell signal is triggered. Additionally, the strategy plots a 200-day EMA as a reference for the long-term trend. The main idea behind this strategy is to capture shifts in market trends by utilizing the crossover of moving averages with different periods.
Strategy Principle
- Calculate the 20-day EMA, 50-day EMA, and 200-day EMA.
- Determine the crossover conditions of the 20-day EMA and 50-day EMA:
- When the 20-day EMA crosses above the 50-day EMA, a buy signal is generated.
- When the 20-day EMA crosses below the 50-day EMA, a sell signal is generated.
- Plot the 20-day EMA (green), 50-day EMA (red), and 200-day EMA (blue) on the chart for visual observation of their trends and crossovers.
- Mark the corresponding buy (green upward triangle) and sell (red downward triangle) signals on the chart when they occur.
Strategy Advantages
- Simplicity: The strategy is based on the simple principle of moving average crossovers, making it easy to understand and implement.
- Trend Following: By utilizing the crossover of short-term and long-term moving averages, the strategy can effectively capture shifts in market trends, making it suitable for trending markets.
- Long-term Trend Reference: The inclusion of the 200-day EMA provides a reference for the long-term market environment.
- Visual Representation: The strategy clearly plots the moving averages and buy/sell signals on the chart, facilitating easy observation and analysis for traders.
Strategy Risks
- Choppy Markets: In choppy markets, frequent moving average crossovers may generate numerous false signals, resulting in suboptimal performance.
- Lag: Moving averages have an inherent lag, potentially missing the optimal timing of market reversals.
- Parameter Sensitivity: The strategy's performance depends on the choice of moving average periods, and different parameter combinations may lead to varying results.
Strategy Optimization Directions
- Incorporating Additional Indicators: Consider incorporating other technical indicators, such as RSI or MACD, to improve signal reliability and accuracy.
- Parameter Optimization: Optimize the moving average period parameters to find the most suitable combination for the current market conditions.
- Implementing Stop-Loss and Take-Profit: Incorporate reasonable stop-loss and take-profit mechanisms to control risk and profitability on individual trades.
- Trend Confirmation: Filter trading signals based on the direction of the long-term trend (e.g., 200-day EMA) and only trade in the direction of the trend.
Summary
The EMA Double Moving Average Crossover Strategy is a simple and straightforward trading strategy suitable for trending markets. It utilizes the crossover of short-term and long-term moving averages to capture shifts in market trends while incorporating a long-term trend reference. Although the strategy has some limitations, such as suboptimal performance in choppy markets and the lag of moving averages, it can be further enhanced by incorporating additional indicators, optimizing parameters, implementing risk management measures, and confirming trends. These optimizations can improve the strategy's robustness and profitability.
- 1