Supertrend and Bollinger Bands Combination Strategy

Overview
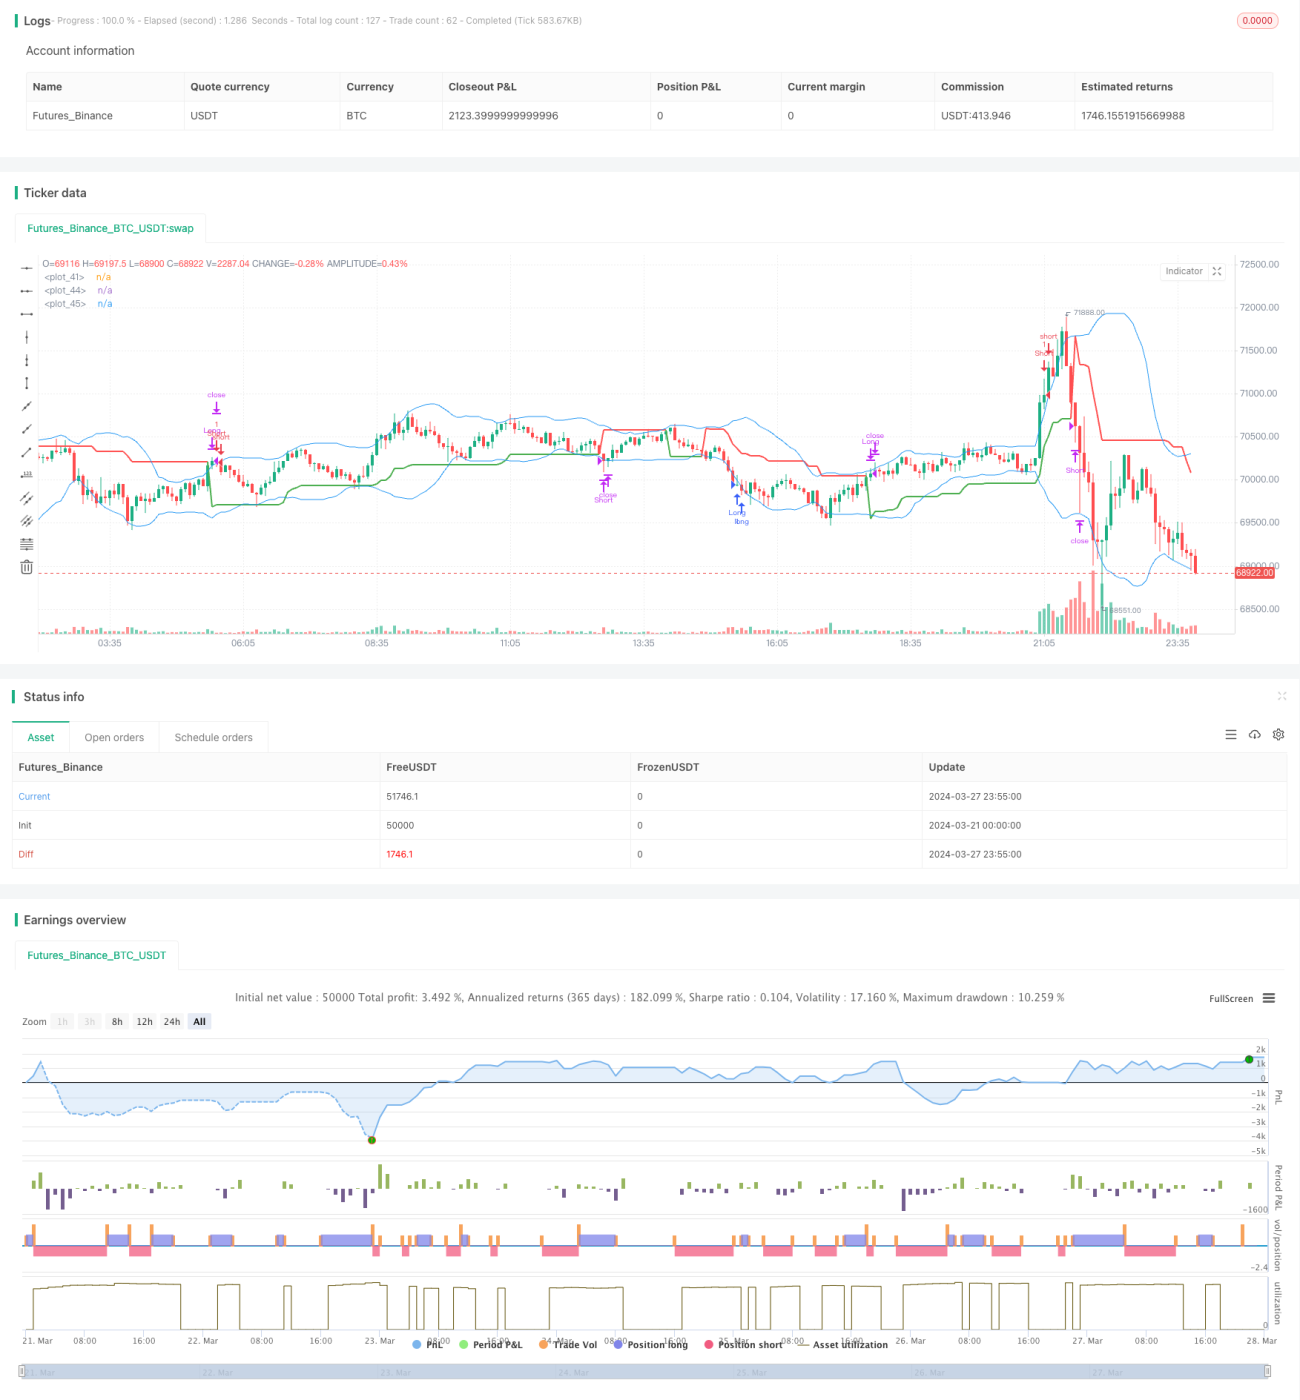
This strategy combines the Supertrend indicator and the Bollinger Bands indicator to capture trending opportunities in the market. The Supertrend indicator is used to determine the current market trend direction, while the Bollinger Bands indicator is used to measure market volatility. A long signal is generated when the closing price breaks above the Supertrend line and is below the lower Bollinger Band, and a short signal is generated when the closing price breaks below the Supertrend line and is above the upper Bollinger Band. The advantage of this strategy is that it can enter the market in a timely manner when the trend is clear, while avoiding premature entry in a choppy market.
Strategy Principles
- Calculate the Average True Range (ATR) and Supertrend indicator to determine the current market trend direction.
- Calculate the upper and lower Bollinger Bands to measure market volatility.
- Generate a long signal when the closing price breaks above the Supertrend line and is below the lower Bollinger Band; generate a short signal when the closing price breaks below the Supertrend line and is above the upper Bollinger Band.
- When holding a long position, if the closing price breaks below the Supertrend line, close the position; when holding a short position, if the closing price breaks above the Supertrend line, close the position.
Strategy Advantages
- Combining information from both the trend and volatility dimensions can more comprehensively grasp market opportunities.
- Able to enter the market in a timely manner when the trend is clear, which helps capture the gains of trending markets.
- In a choppy market, the combination of Bollinger Bands and Supertrend can effectively filter out false breakout signals and reduce the risk of losses.
- The code logic is clear, with few parameters, and is easy to understand and implement.
Strategy Risks
- In a unilateral trending market, due to frequent breakout signals, it may lead to excessive trading frequency and increase transaction costs.
- The capture of breakout points relies on the Supertrend indicator, which is sensitive to parameters, and the indicator trends vary greatly under different parameters, which may affect the strategy's effectiveness.
- The width of the Bollinger Bands will change with changes in market volatility, and may widen stop-losses in high-volatility environments.
Strategy Optimization Directions
- Consider introducing more effective filtering conditions, such as trading volume, market sentiment, etc., to further improve the reliability of signals.
- For the parameters of the Supertrend indicator, optimization tests can be conducted to select the optimal parameters to improve strategy stability.
- In terms of trade execution, more detailed position management and risk control measures can be introduced, such as setting trailing stops, dynamically adjusting positions, etc., to reduce the risk exposure of a single trade.
Summary
The Supertrend Bollinger Band combination strategy is a trend-following strategy that can effectively capture trending opportunities by combining two market factors: trend and volatility. However, this strategy also has certain limitations, such as being sensitive to parameters and increased risk in high-volatility environments. Therefore, in actual application, it is necessary to appropriately optimize and improve the strategy according to market characteristics and one's own risk preferences.
- 1