Overview
The “Dual Moving Average Lagging Breakout Strategy” is a commonly used technical analysis trading strategy. This strategy combines two simple moving averages (SMAs) with different periods and the Average True Range (ATR) indicator, aiming to capture turning points in market trends and achieve low-risk, high-return trading. Its core idea is to utilize the lagging nature of moving averages and market volatility, generating trading signals when prices break through moving averages and the volatility is within a controllable range.
Strategy Principle
The main principles of this strategy are as follows:
- Calculate two simple moving averages (SMAs) with different periods, with default periods of 14 and 50.
- Calculate the ATR indicator to measure market volatility, with a default period of 14.
- Plot ATR upper and lower bands as reference ranges for price fluctuations. The upper band is obtained by adding the ATR multiplied by a factor (default 1.5) to the highest price, and the lower band is obtained by subtracting the ATR multiplied by the factor from the lowest price.
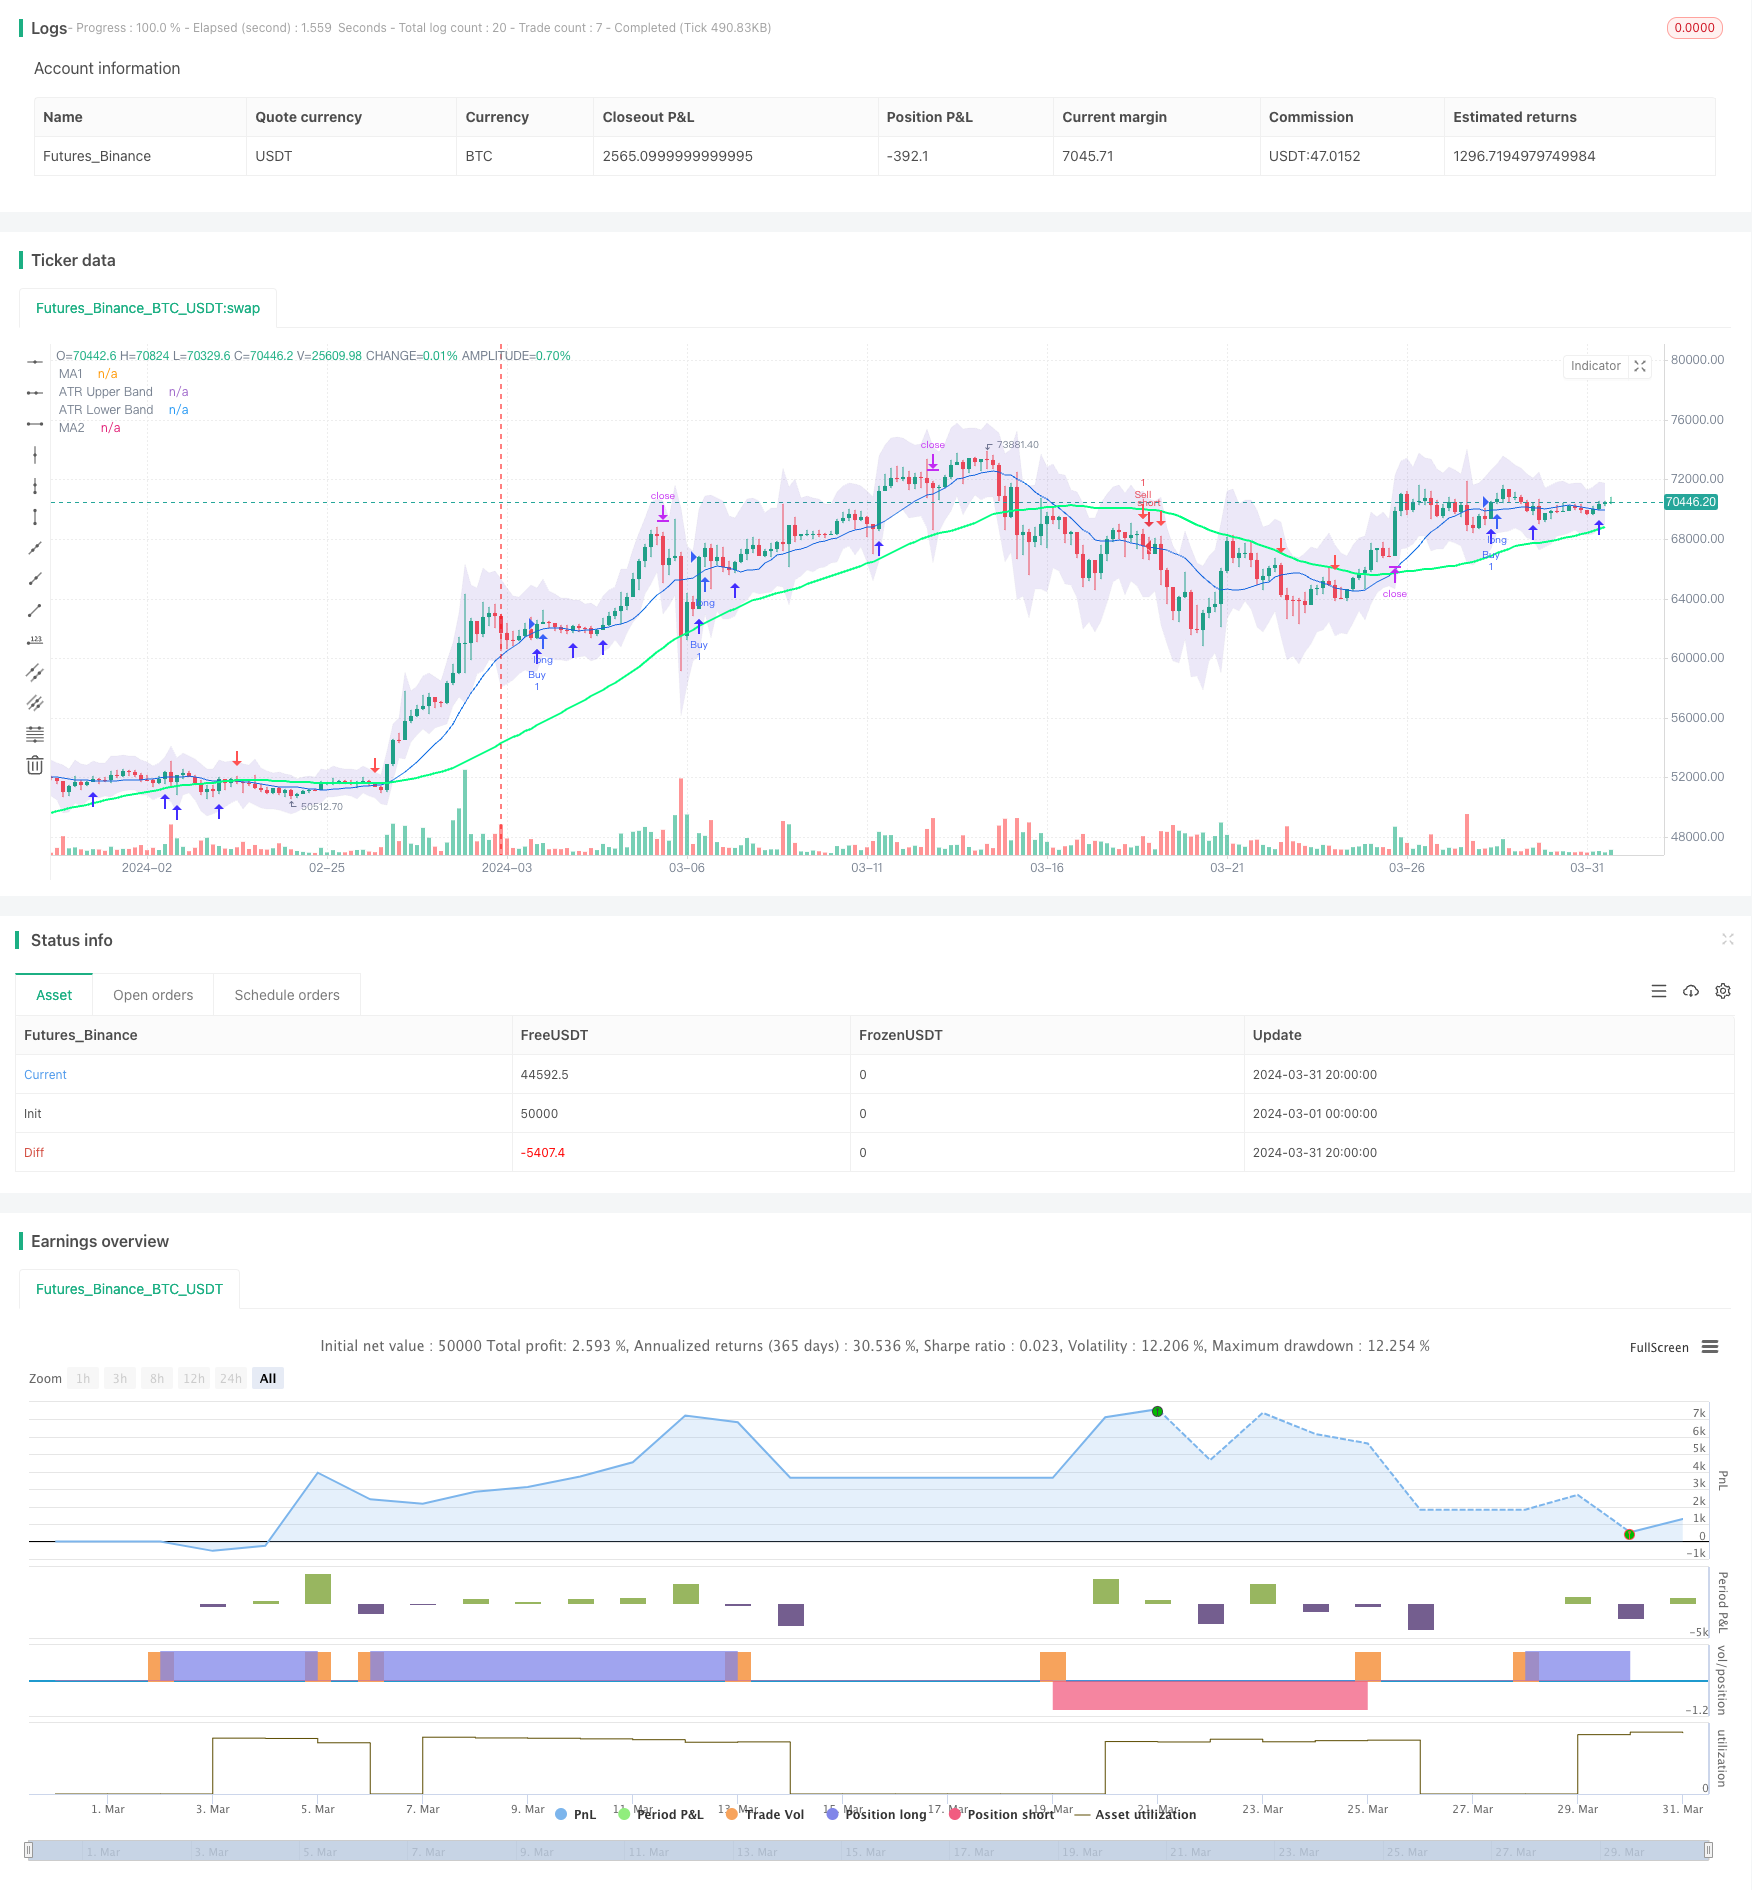
- When the closing price crosses above the short-term moving average and the short-term moving average is above the long-term moving average, a long signal is generated, and an upward arrow is drawn below the candlestick.
- When the closing price crosses below the short-term moving average and the short-term moving average is below the long-term moving average, a short signal is generated, and a downward arrow is drawn above the candlestick.
- Set stop-loss and take-profit levels. The stop-loss level is the lowest price minus the ATR multiplied by the factor, and the take-profit level is the entry price plus (entry price - stop-loss level) multiplied by 2.
From the above principles, it can be seen that this strategy combines the trend judgment of the moving average system and the volatility measurement of the ATR indicator, focusing on trend following while controlling drawdown risk, making it a trend-following strategy.
Advantage Analysis
The “Dual Moving Average Lagging Breakout Strategy” has the following advantages:
- Trend tracking: It judges the trend direction through the moving average system, captures major market trends, and follows the market.
- Risk control: It utilizes the ATR indicator to measure market volatility and sets reasonable stop-loss levels to keep drawdowns within an acceptable range.
- Flexible parameters: Parameters such as moving average periods, ATR period, and multiplier can be optimized and adjusted according to different markets and instruments, providing a certain degree of universality.
- Simple and straightforward: Trading signals are simple and clear, suitable for investors at different levels.
Risk Analysis
Although this strategy has certain advantages, it still has the following risks:
- Frequent trading: When the market is highly volatile and the trend is unclear, this strategy may generate frequent trading signals, increasing trading costs.
- Lag: The moving average system inherently has a certain lag, and there may be some drawdown at the beginning of market turning points.
- Parameter optimization: Different parameter settings have a significant impact on strategy performance, requiring parameter optimization for different markets and instruments, increasing the difficulty of implementation.
To address the above risks, the strategy can be optimized and improved from the following aspects: 1. Introduce trend filtering: Before generating trading signals, first determine the trend direction of the larger timeframe, and only trade when the trend is clear in the larger timeframe, reducing frequent trading. 2. Optimize stop-loss and take-profit: Consider introducing dynamic stop-loss methods such as trailing stop-loss and volatility stop-loss, as well as dynamically adjusting take-profit levels based on market volatility to improve strategy flexibility. 3. Combination optimization: Combine this strategy with other technical indicators or fundamental factors to improve the robustness of the strategy.
Optimization Direction
This strategy can be optimized from the following aspects:
- Adaptive parameter optimization: For different instruments and timeframes, automatically find the optimal parameter combination to reduce the workload of manual parameter tuning. Methods such as genetic algorithms and grid search can be used for optimization.
- Signal filtering: After generating trading signals, further introduce other technical indicators or fundamental factors for secondary confirmation of signals to improve signal quality. For example, add volume indicators to judge trend strength; add macroeconomic data to determine whether the overall environment is conducive to trend continuation.
- Position management: When opening positions, dynamically adjust position size based on factors such as market volatility and account risk to control single-trade risk. Methods such as the Kelly formula and fixed ratio method can be used for position management.
- Trailing stop-loss: The initial stop-loss level is fixed. As the price moves in a favorable direction, consider moving the stop-loss level in the favorable direction as well to reduce drawdown and improve capital utilization efficiency. Common methods include trailing stop-loss and breakout stop-loss.
The above optimizations can improve the adaptability, robustness, and profitability of the strategy, but it should be noted that over-optimization may lead to curve fitting, resulting in poor out-of-sample performance. Therefore, sufficient backtesting and validation should be conducted both in-sample and out-of-sample.
Summary
The “Dual Moving Average Lagging Breakout Strategy” is a classic trend-following strategy that determines trend direction through the moving average system and controls risk using the ATR indicator, capturing trend movements while managing risk. Although it has certain lag and frequent trading issues, the strategy’s performance can be further improved through methods such as optimizing stop-loss and take-profit levels, introducing signal filtering, adaptive parameter optimization, and position management, making it a practical quantitative trading strategy.
/*backtest
start: 2024-03-01 00:00:00
end: 2024-03-31 23:59:59
period: 4h
basePeriod: 15m
exchanges: [{"eid":"Futures_Binance","currency":"BTC_USDT"}]
*/

//@version=4
strategy(title="2 Moving Averages", shorttitle="2MA", overlay=true)

// Moving Averages
len = input(14, minval=1, title="Length MA1")
src = input(close, title="Source MA1")
ma1 = sma(src, len)

len2 = input(50, minval=1, title="Length MA2")
src2 = input(close, title="Source MA2")
ma2 = sma(src2, len2)

// Plotting Moving Averages
plot(ma1, color=#0b6ce5, title="MA1")
plot(ma2, color=#00ff80, linewidth=2, title="MA2")

// ATR Bands
atrLength = input(14, title="ATR Length")
atrMultiplier = input(1.5, title="ATR Multiplier")
upperBand = high + atr(atrLength) * atrMultiplier
lowerBand = low - atr(atrLength) * atrMultiplier

u =plot(upperBand, color=color.rgb(217, 220, 223, 84), title="ATR Upper Band")
l = plot(lowerBand, color=color.rgb(217, 220, 223, 84), title="ATR Lower Band")
fill(u, l, color=#471eb821, title="ATR Background")

// Conditions for plotting arrows
upArrowCondition = ma1 > ma2 and crossover(close, ma1)
downArrowCondition = ma1 < ma2 and crossunder(close, ma1)

// Plotting arrows
plotshape(upArrowCondition, style=shape.arrowup, color=color.rgb(66, 45, 255), size=size.normal, location=location.belowbar, title="Up Arrow")
plotshape(downArrowCondition, style=shape.arrowdown, color=color.red, size=size.normal, location=location.abovebar, title="Down Arrow")
// Checkbox for trade execution
showTrades = input(true, title="Hiển thị giao dịch")

// Buy Condition
if (upArrowCondition and showTrades)
    strategy.entry("Buy", strategy.long)

// Sell Condition
if (downArrowCondition and showTrades)
    strategy.entry("Sell", strategy.short)

// Stop Loss and Take Profit
stopLossBuy = low - atr(14) * atrMultiplier
takeProfitBuy = close + (close - stopLossBuy) * 2

stopLossSell = high + atr(14) * atrMultiplier
takeProfitSell = close - (stopLossSell - close) * 2

strategy.exit("Exit Buy", "Buy", stop=stopLossBuy, limit=takeProfitBuy)
strategy.exit("Exit Sell", "Sell", stop=stopLossSell, limit=takeProfitSell)