RSI and Bollinger Bands Double Strategy

Overview
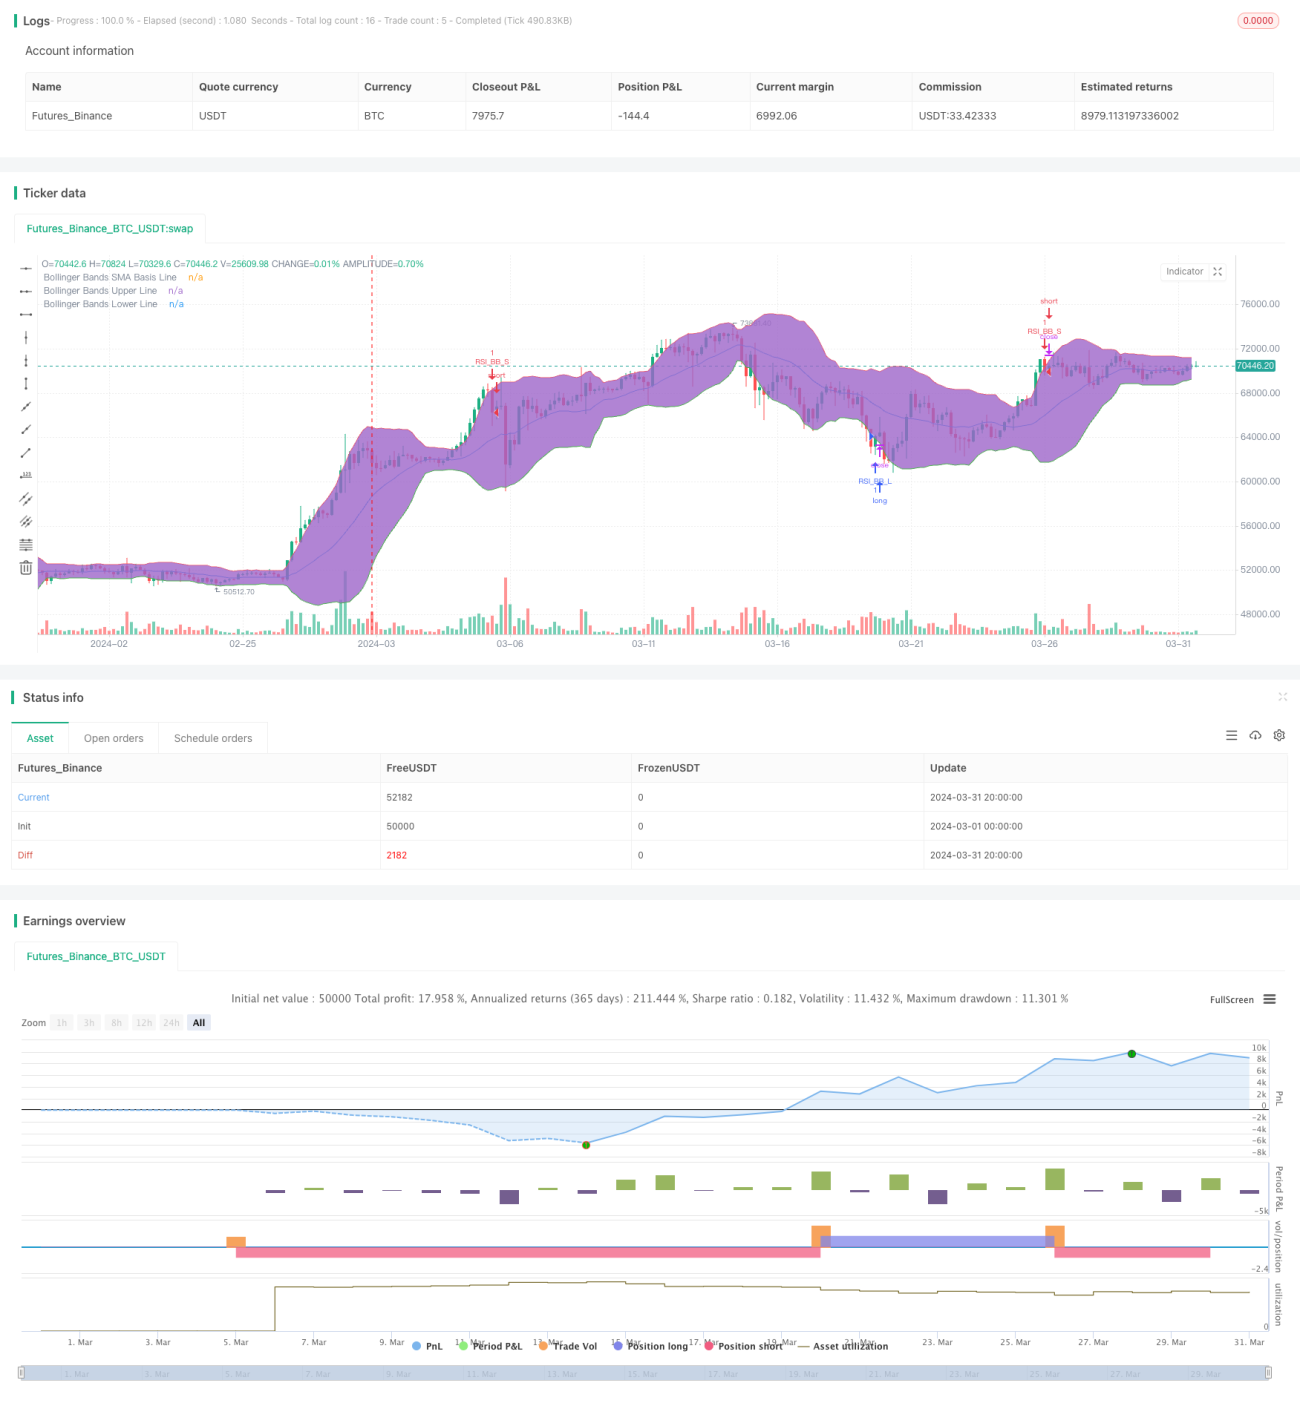
This strategy combines the Relative Strength Index (RSI) and Bollinger Bands technical indicators. It generates buy signals when the price falls below the lower Bollinger Band and sell signals when the price rises above the upper Bollinger Band. The strategy only triggers trading signals when both the RSI and Bollinger Bands indicators are simultaneously in an oversold or overbought state.
Strategy Logic
- Calculate the RSI value based on the set RSI parameters.
- Use the Bollinger Bands formula to calculate the middle, upper, and lower Bollinger Bands.
- Determine if the current closing price breaks through the upper or lower Bollinger Band.
- Determine if the current RSI value is above the overbought threshold or below the oversold threshold.
- Generate corresponding buy or sell signals when both the Bollinger Bands and RSI indicators meet the respective conditions.
Strategy Advantages
- Combines trend and momentum indicators for a more comprehensive assessment of market conditions.
- Using two indicators as filters effectively reduces the probability of false signals.
- Clear code logic and flexible parameter settings, suitable for different market environments and trading styles.
Strategy Risks
- In choppy markets, this strategy may generate more losing trades.
- Improper parameter settings may lead to poor strategy performance and require optimization based on actual conditions.
- The strategy does not include a stop-loss, potentially exposing it to significant drawdown risk.
Strategy Optimization Directions
- Optimize RSI and Bollinger Bands parameters based on market characteristics and personal preferences.
- Introduce additional technical indicators such as MACD, moving averages, etc., to improve signal reliability.
- Set reasonable stop-loss and take-profit levels to control single-trade risk.
- For choppy markets, consider adding more conditions or reducing position size to lower costs associated with frequent trading.
Summary
The RSI and Bollinger Bands Double Strategy combines trend and momentum indicators to provide a relatively comprehensive assessment of market conditions and generate corresponding trading signals. However, the strategy may underperform in choppy markets and lacks risk control measures, so caution is needed when applying it to live trading. By optimizing parameters, introducing other indicators, and setting reasonable stop-loss and take-profit levels, the stability and profitability of this strategy can be further improved.
/*backtest
start: 2024-03-01 00:00:00
end: 2024-03-31 23:59:59
period: 4h
basePeriod: 15m
exchanges: [{"eid":"Futures_Binance","currency":"BTC_USDT"}]
*/

//@version=4
strategy("Bollinger + RSI, Double Strategy (by ChartArt) v1.1", shorttitle="CA_-_RSI_Bol_Strat_1.1", overlay=true)

// ChartArt's RSI + Bollinger Bands, Double Strategy - Update- 1