SPARK Dynamic Position Sizing and Dual Indicator Trading Strategy

Overview
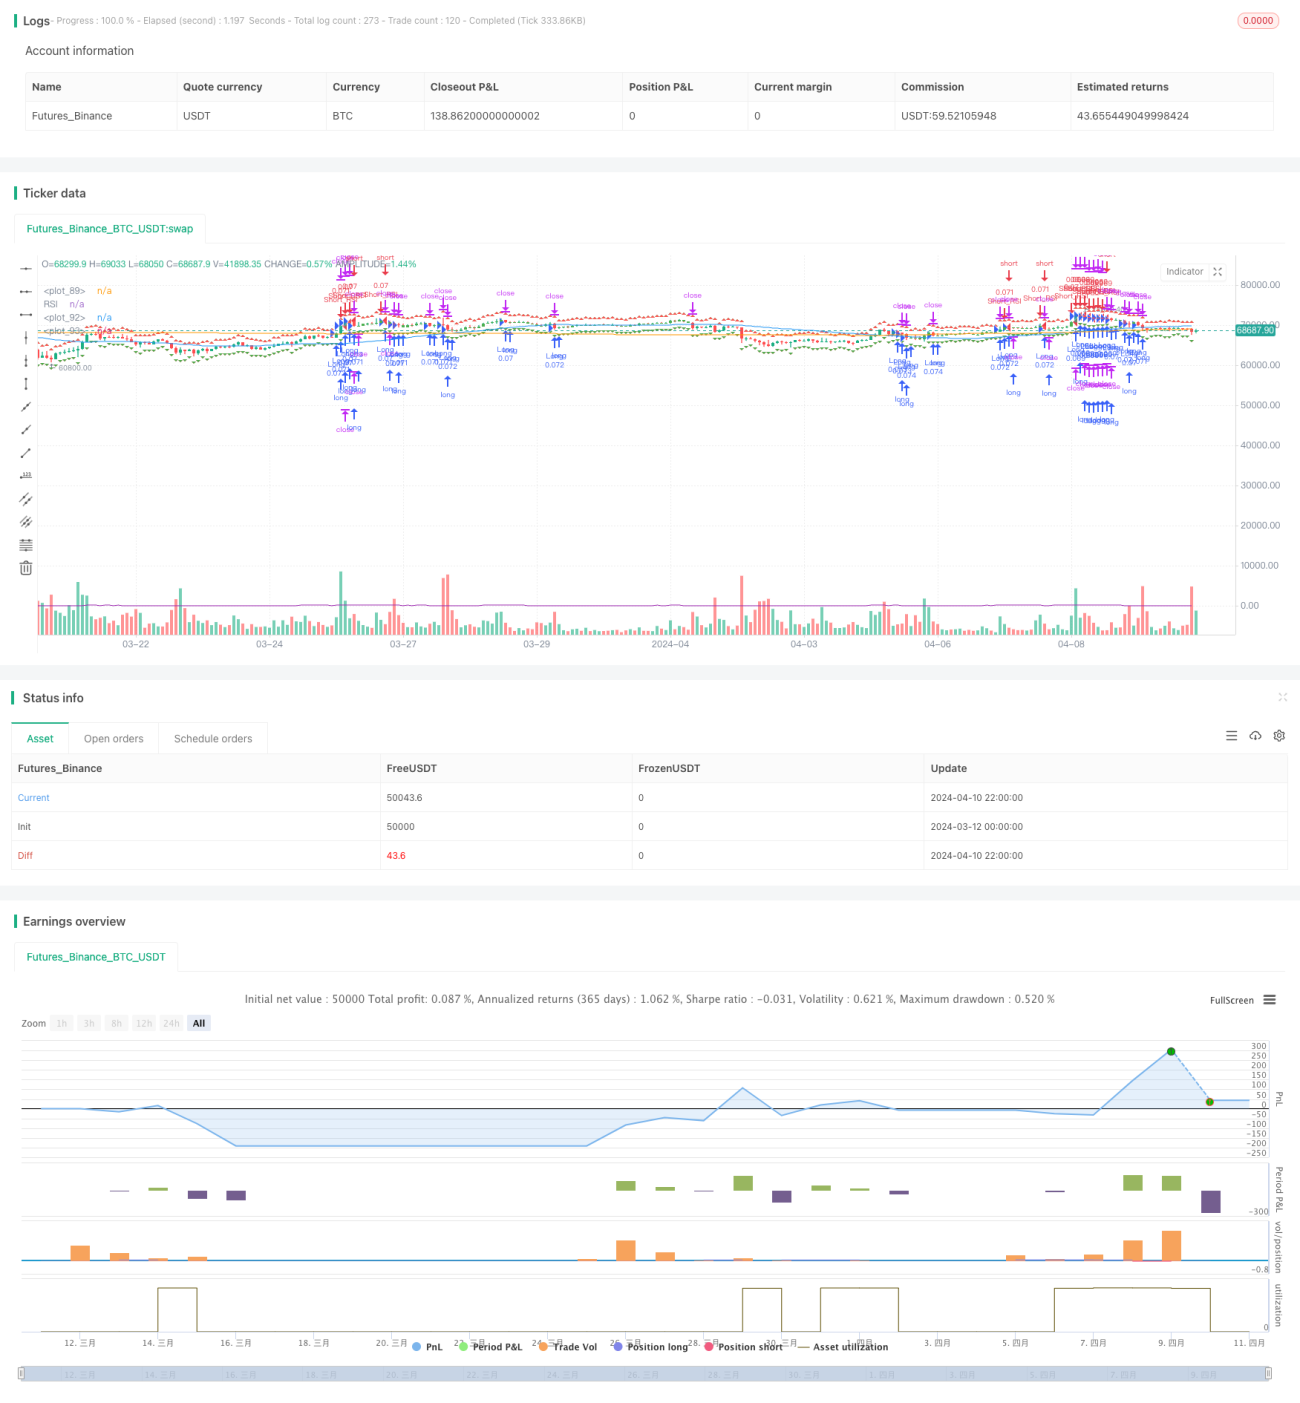
The SPARK strategy is a quantitative trading strategy that combines dynamic position sizing with dual indicator confirmation. The strategy utilizes the SuperTrend indicator and the Relative Strength Index (RSI) to identify potential entry and exit points while employing a dynamic position sizing mechanism to optimize capital allocation. The strategy also offers flexible take profit and stop loss settings, as well as customizable parameters such as minimum trading frequency and directional preference.
Strategy Principles
The core of the SPARK strategy lies in the combined application of the SuperTrend indicator and the RSI indicator. The SuperTrend indicator determines the trend direction by comparing the closing price with dynamic support and resistance levels, while the RSI indicator is used to identify overbought and oversold market conditions. When both the SuperTrend and RSI indicators simultaneously meet specific criteria, the strategy generates an entry signal.
The strategy employs a dynamic position sizing mechanism to optimize capital allocation for each trade. By setting a portfolio percentage and leverage ratio, the strategy automatically calculates the optimal position size based on current market conditions and account balance. Additionally, the strategy offers flexible take profit and stop loss settings, allowing users to choose between fixed percentages or dynamically calculated levels.
Strategy Advantages
- Dual Indicator Confirmation: By combining the SuperTrend and RSI indicators, the SPARK strategy can more accurately identify potential entry and exit points, reducing the likelihood of false signals.
- Dynamic Position Sizing: The strategy employs a dynamic position sizing mechanism that automatically optimizes capital allocation for each trade based on portfolio percentage and leverage ratio, enhancing capital efficiency.
- Flexible Risk Management: The strategy offers flexible take profit and stop loss settings, allowing users to choose between fixed percentages or dynamically calculated levels based on their risk preferences, enabling precise risk control.
- Customizable Parameters: The strategy allows users to adjust multiple input parameters, such as ATR length, multiplier, and RSI thresholds, to adapt to different market conditions and trading preferences.
Strategy Risks
- Market Risk: Despite the SPARK strategy's dual indicator confirmation and dynamic position sizing mechanism, it may still face the risk of losses under extreme market conditions.
- Parameter Optimization Risk: The strategy's performance largely depends on the selection of input parameters. Inappropriate parameter settings may lead to suboptimal strategy performance.
- Overfitting Risk: If the strategy parameters are over-optimized, it may result in poor performance under future market conditions.
Strategy Optimization Directions
- Incorporating Additional Indicators: Consider incorporating other technical indicators, such as MACD, Bollinger Bands, etc., to further enhance the accuracy of signal confirmation.
- Optimizing Take Profit and Stop Loss Mechanisms: Explore more advanced take profit and stop loss strategies, such as trailing stops, dynamic take profit levels, etc., to better protect profits and limit losses.
- Adaptive Parameter Adjustment: Develop an adaptive mechanism that dynamically adjusts strategy parameters based on market conditions to adapt to the ever-changing market environment.
Summary
The SPARK strategy provides traders with a comprehensive quantitative trading solution by combining the SuperTrend and RSI indicators, employing a dynamic position sizing mechanism, and offering flexible risk management tools. Although the strategy may face certain risks, with continuous optimization and refinement, the SPARK strategy has the potential to deliver consistent performance across various market conditions.
- 1