RSI and Dual EMA Crossover Signal Quantitative Strategy

Overview
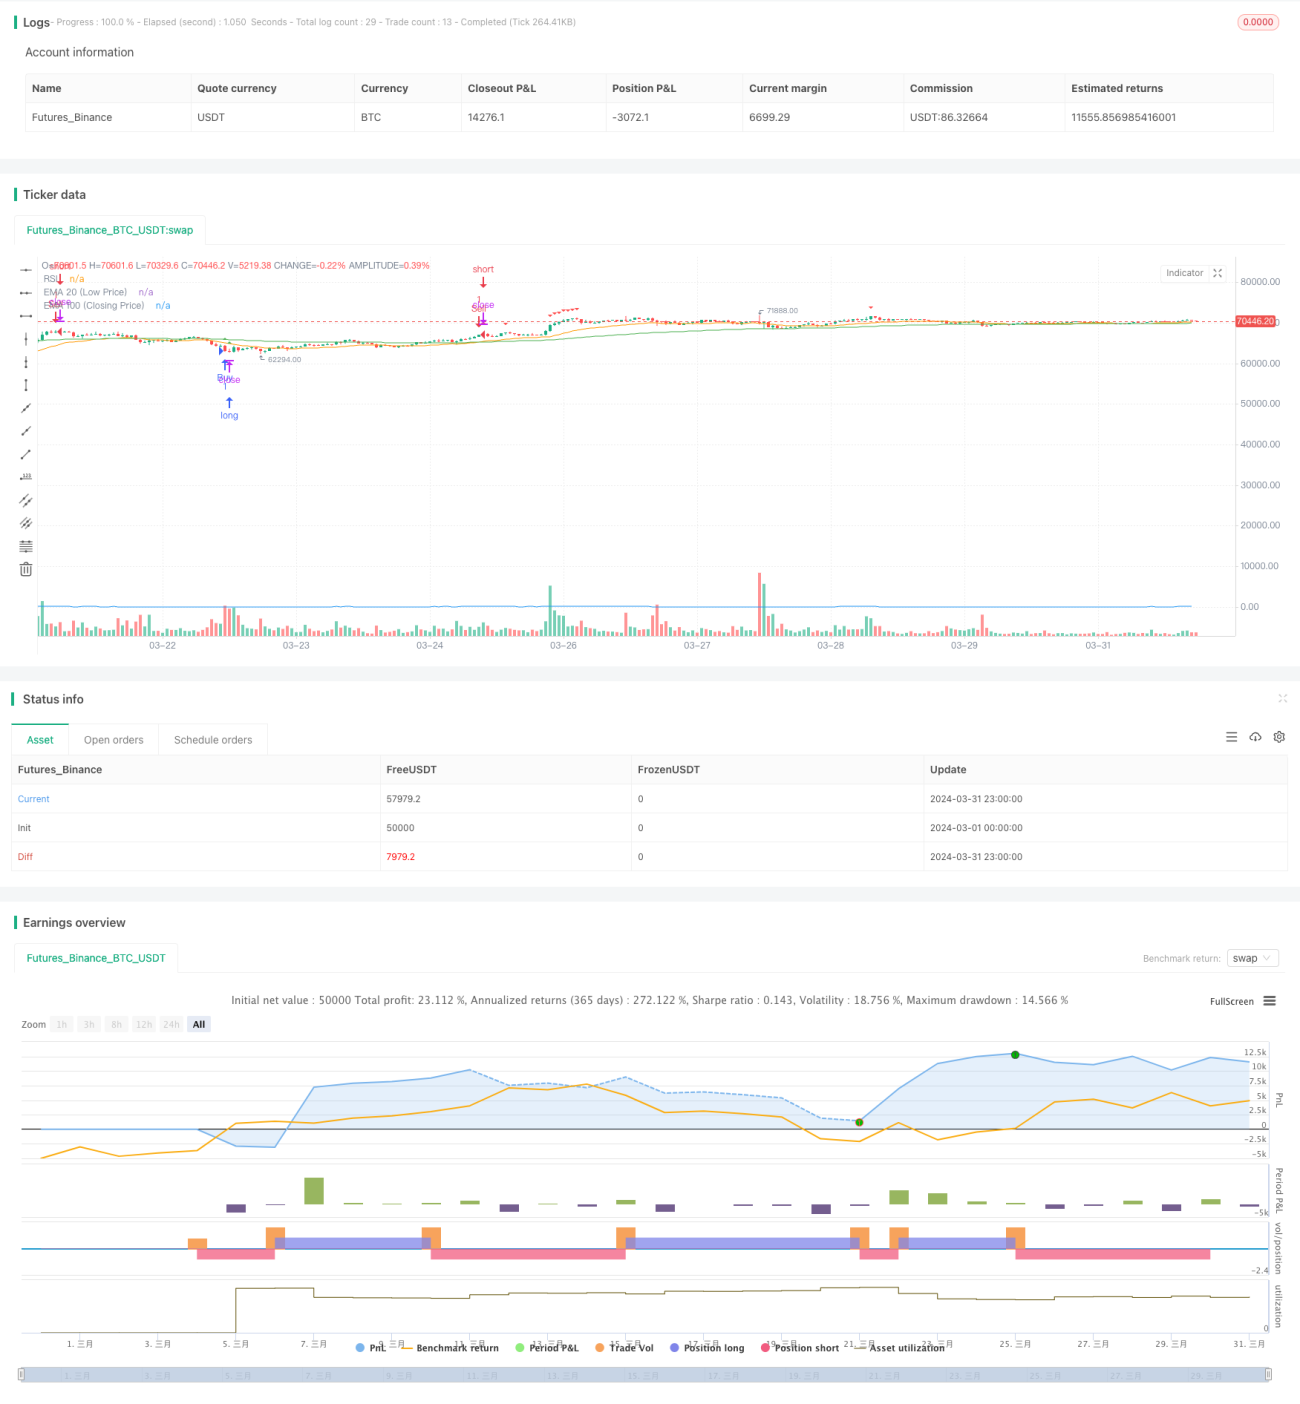
This strategy uses the crossover signals of the RSI indicator and two EMA lines to determine buy and sell points. A buy signal is generated when the closing price falls below both EMA100 and EMA20, and the RSI value is below 30. A sell signal is generated when the closing price breaks above both EMA100 and EMA20, and the RSI value is above 70. The main idea of this strategy is to use the RSI indicator to judge overbought and oversold conditions, combined with the trend judgment of EMA lines, in order to capture the low and high points of market fluctuations and perform low-buy and high-sell operations.
Strategy Principle
- Calculate the RSI indicator value to determine overbought and oversold conditions in the market. An RSI below 30 is considered oversold, while an RSI above 70 is considered overbought.
- Calculate the EMA100 of the closing price and the EMA20 of the lowest price as the basis for trend judgment.
- When the closing price falls below both EMA100 and EMA20, and the RSI is below 30, it is judged as oversold and the trend is downward, generating a buy signal.
- When the closing price breaks above both EMA100 and EMA20, and the RSI is above 70, it is judged as overbought and the trend is upward, generating a sell signal.
- Open a long position when a buy signal is triggered, and close the position when a sell signal is triggered.
Advantage Analysis
- Combining the RSI indicator with EMA moving averages can better judge trend turning points and overbought/oversold timing, reducing false signals.
- Parameters are adjustable and can be optimized for different underlying assets and periods, providing certain adaptability and flexibility.
- The logic is simple and clear, easy to understand and implement, and does not require too much technical analysis foundation.
- Suitable for use in a fluctuating market, it can capture the highs and lows of fluctuations and profit from price differences.
Risk Analysis
- It may fail in unilateral trend markets, and will repeatedly generate false signals and be stuck after the trend is formed.
- Parameters are fixed and lack the ability to dynamically adapt to the market, easily affected by changes in market rhythm.
- Frequent trading in a fluctuating market may generate significant slippage and transaction fees, affecting strategy returns.
- Lack of position management and risk control measures, drawdown and maximum loss are uncontrollable.
Optimization Direction
- Add trend judgment conditions, such as MA crossover, DMI, etc., to avoid premature entry and getting stuck in unilateral trends.
- Optimize the parameters of RSI and EMA to find the most suitable parameter combination for the underlying asset and period, improving signal accuracy.
- Introduce a position management model, such as ATR position sizing or Kelly formula, to control the proportion of funds in each trade and reduce risk.
- Set stop-loss and take-profit conditions, such as fixed percentage stop-loss or trailing stop-loss, to control the maximum loss and profit surrender of a single trade.
- Combine with other auxiliary indicators such as MACD, Bollinger Bands, etc., to improve signal confirmation and reduce misjudgments.
Summary
The RSI and Dual EMA Crossover Signal Quantitative Strategy is a simple and practical quantitative trading strategy. By combining the RSI indicator with EMA moving averages, it can better capture the highs and lows in a fluctuating market and conduct arbitrage. However, this strategy also has some limitations and risks, such as failure in trend markets, lack of position management and risk control measures, etc. Therefore, in practical application, it needs to be appropriately optimized and improved according to market characteristics and personal preferences to improve the robustness and profitability of the strategy. This strategy can be used as an entry-level strategy for quantitative trading to learn and use, but it needs to be treated with caution and risk must be strictly controlled.
- 1