HTF Zigzag Path Strategy

Overview
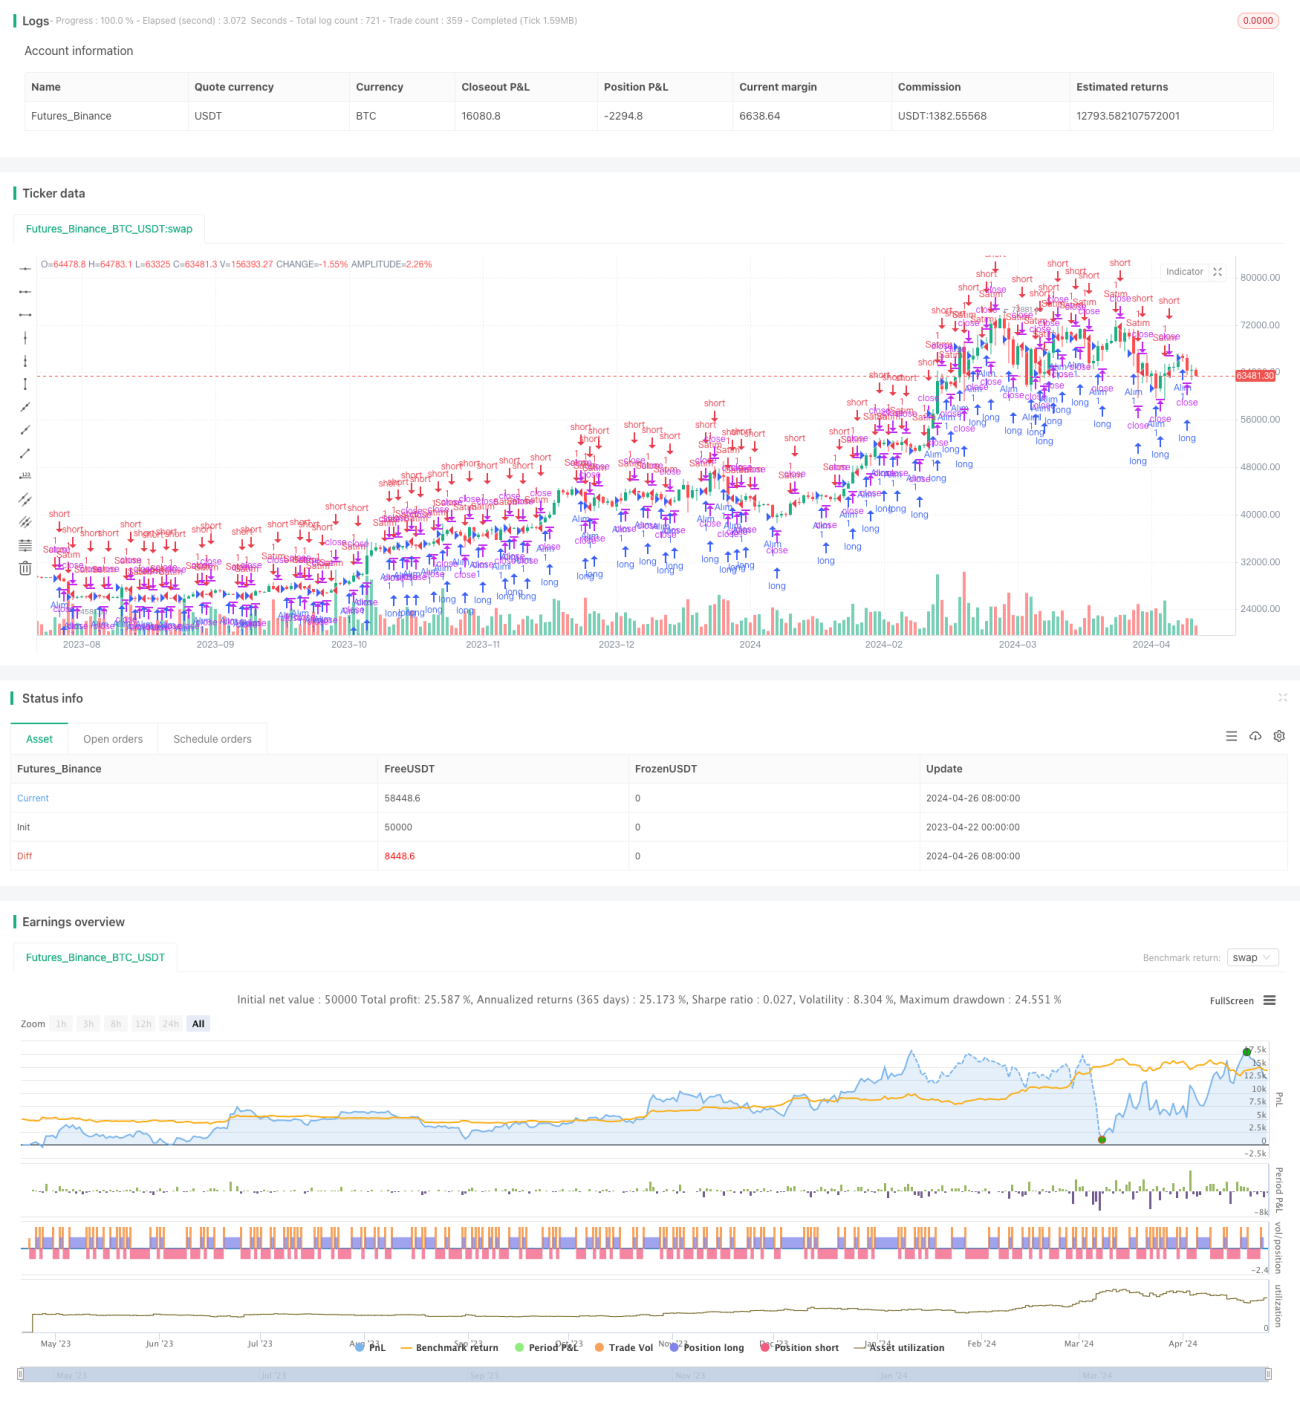
The strategy utilizes the ZigZag indicator on a higher time frame (HTF) to plot the ZigZag path on a lower time frame (LTF) chart and generates trading signals based on the opening and closing prices of the HTF candles. The main idea behind the strategy is to use the trend direction of the HTF to guide trading decisions on the LTF while using the ZigZag indicator to identify key support and resistance levels.
Strategy Principles
- Obtain data for the user-specified HTF time frame (default is 15 minutes), including open, high, low, close prices, as well as the opening and closing times.
- Draw boxes on the LTF chart to display the HTF candles, showing the price movement of the HTF.
- Use the ZigZag indicator to connect the high and low points of the HTF, forming the ZigZag path.
- Generate trading signals based on the opening and closing prices of the HTF candles:
- If the closing price of the HTF candle is lower than the opening price, a long signal is generated.
- If the closing price of the HTF candle is higher than the opening price, a short signal is generated.
- Execute the corresponding buy or sell operations based on the trading signals.
Strategy Advantages
- Utilizing the trend direction of the HTF to guide trading decisions on the LTF can help traders capture the larger trend and improve the success rate of trades.
- Using the ZigZag indicator to connect the high and low points of the HTF provides a clear visualization of key support and resistance levels, serving as a reference for trading decisions.
- The strategy logic is simple and straightforward, making it easy to understand and implement.
- By drawing boxes of the HTF candles on the LTF chart, traders can intuitively observe the relationship between the price movements of the HTF and LTF, aiding in making more informed decisions.
Strategy Risks
- The strategy generates trading signals solely based on the opening and closing prices of the HTF candles, potentially missing important price movement information and leading to missed trading opportunities.
- The ZigZag indicator may produce some false signals, especially in highly volatile market conditions or when the trend is unclear, requiring cautious interpretation.
- The strategy does not consider risk management and position sizing, which may expose traders to significant risk.
- The strategy lacks consideration of market sentiment and fundamental factors, making it susceptible to the impact of unexpected events that may generate false signals.
Strategy Optimization Directions
- Incorporate additional technical indicators or market sentiment indicators, such as the Relative Strength Index (RSI) or Moving Averages (MA), to improve the reliability of trading signals.
- Optimize the parameter settings of the ZigZag indicator, such as adjusting the minimum price change percentage or minimum swing points, to adapt to different market conditions and trading instruments.
- Implement risk management and position sizing modules, such as setting stop-loss and take-profit levels or dynamically adjusting position sizes, to reduce the strategy's risk exposure.
- Consider incorporating fundamental analysis or market sentiment analysis, such as economic data releases or significant events, to enhance the adaptability and robustness of the strategy.
Summary
The HTF Zigzag Path strategy utilizes the ZigZag indicator on a higher time frame to plot the ZigZag path on a lower time frame chart and generates trading signals based on the opening and closing prices of the HTF candles. The strategy's strength lies in using the trend direction of the HTF to guide trading decisions on the LTF while leveraging the ZigZag indicator to identify key support and resistance levels. However, the strategy also has some risks, such as potentially missing important price movement information and the possibility of false signals from the ZigZag indicator. To optimize the strategy, considerations can be given to incorporating additional technical indicators, optimizing ZigZag indicator parameters, implementing risk management and position sizing modules, and incorporating fundamental and market sentiment analysis.
- 1