Z-Score Trend Following Strategy

Overview
The "Z-Score Trend Following Strategy" leverages the Z-score, a statistical measure that gauges the deviation of a price from its moving average, normalized against its standard deviation. This strategy stands out due to its simplicity and effectiveness, particularly in markets where price movements often revert to a mean. Unlike more complex systems that might rely on a multitude of indicators, the Z-Trend strategy focuses on clear, statistically significant price movements, making it ideal for traders who prefer a streamlined, data-driven approach.
Strategy Principle
Central to this strategy is the calculation of the Z-score. It is derived by taking the difference between the current price and the Exponential Moving Average (EMA) of the price over a user-defined length, then dividing this by the standard deviation of the price over the same length:
z = (x - μ) / σ
Where x is the current price, μ is the EMA mean, and σ is the standard deviation.
Trading signals are generated based on the Z-score crossing predefined thresholds:
- Long Entry: When the Z-score crosses above the positive threshold.
- Long Exit: When the Z-score falls below the negative threshold.
- Short Entry: When the Z-score falls below the negative threshold.
- Short Exit: When the Z-score rises above the positive threshold.
Strategy Advantages
- Simplicity and effectiveness: The strategy relies on few parameters, is easy to understand and implement, while being highly effective in capturing trending opportunities.
- Statistical foundation: The Z-score, as an established statistical tool, provides a solid theoretical basis for the strategy.
- Adaptability: By adjusting parameters such as thresholds, EMA, and standard deviation calculation periods, the strategy can flexibly adapt to various trading styles and market environments.
- Clear signals: Trading signals based on Z-score crossovers are straightforward, facilitating quick decision-making and execution.
Strategy Risks
- Parameter sensitivity: Inappropriate parameter settings (e.g., overly high or low thresholds) can distort trading signals, leading to missed opportunities or losses.
- Trend identification: In choppy or rangebound markets, the strategy may face frequent false signals and underperform.
- Lag effect: As a trend-following strategy, its entry and exit signals inherently lag, potentially missing optimal timing.
These risks can be managed and mitigated through ongoing market analysis, parameter optimization, and prudent implementation based on backtesting.
Strategy Optimization Directions
- Dynamic thresholds: Introducing volatility-based dynamic thresholds can effectively adapt to different market states and enhance signal quality.
- Indicator combinations: Integrating other technical indicators like RSI, MACD, etc., for secondary confirmation of trading signals can improve reliability.
- Position sizing: Incorporating position control mechanisms such as ATR can help timely reduce exposure in choppy markets and increase it in trending ones, optimizing the risk-reward ratio.
- Multiple timeframes: Calculating Z-scores across multiple timeframes can capture trends at different levels, enriching the strategy's dimensions.
Summary
The "Z-Score Trend Following Strategy," with its simplicity, robustness, and flexibility, offers a unique perspective for capturing trending opportunities. Through proper parameter settings, prudent risk management, and continuous optimization, this strategy can be a powerful tool for quantitative traders to navigate the ever-changing markets with confidence.
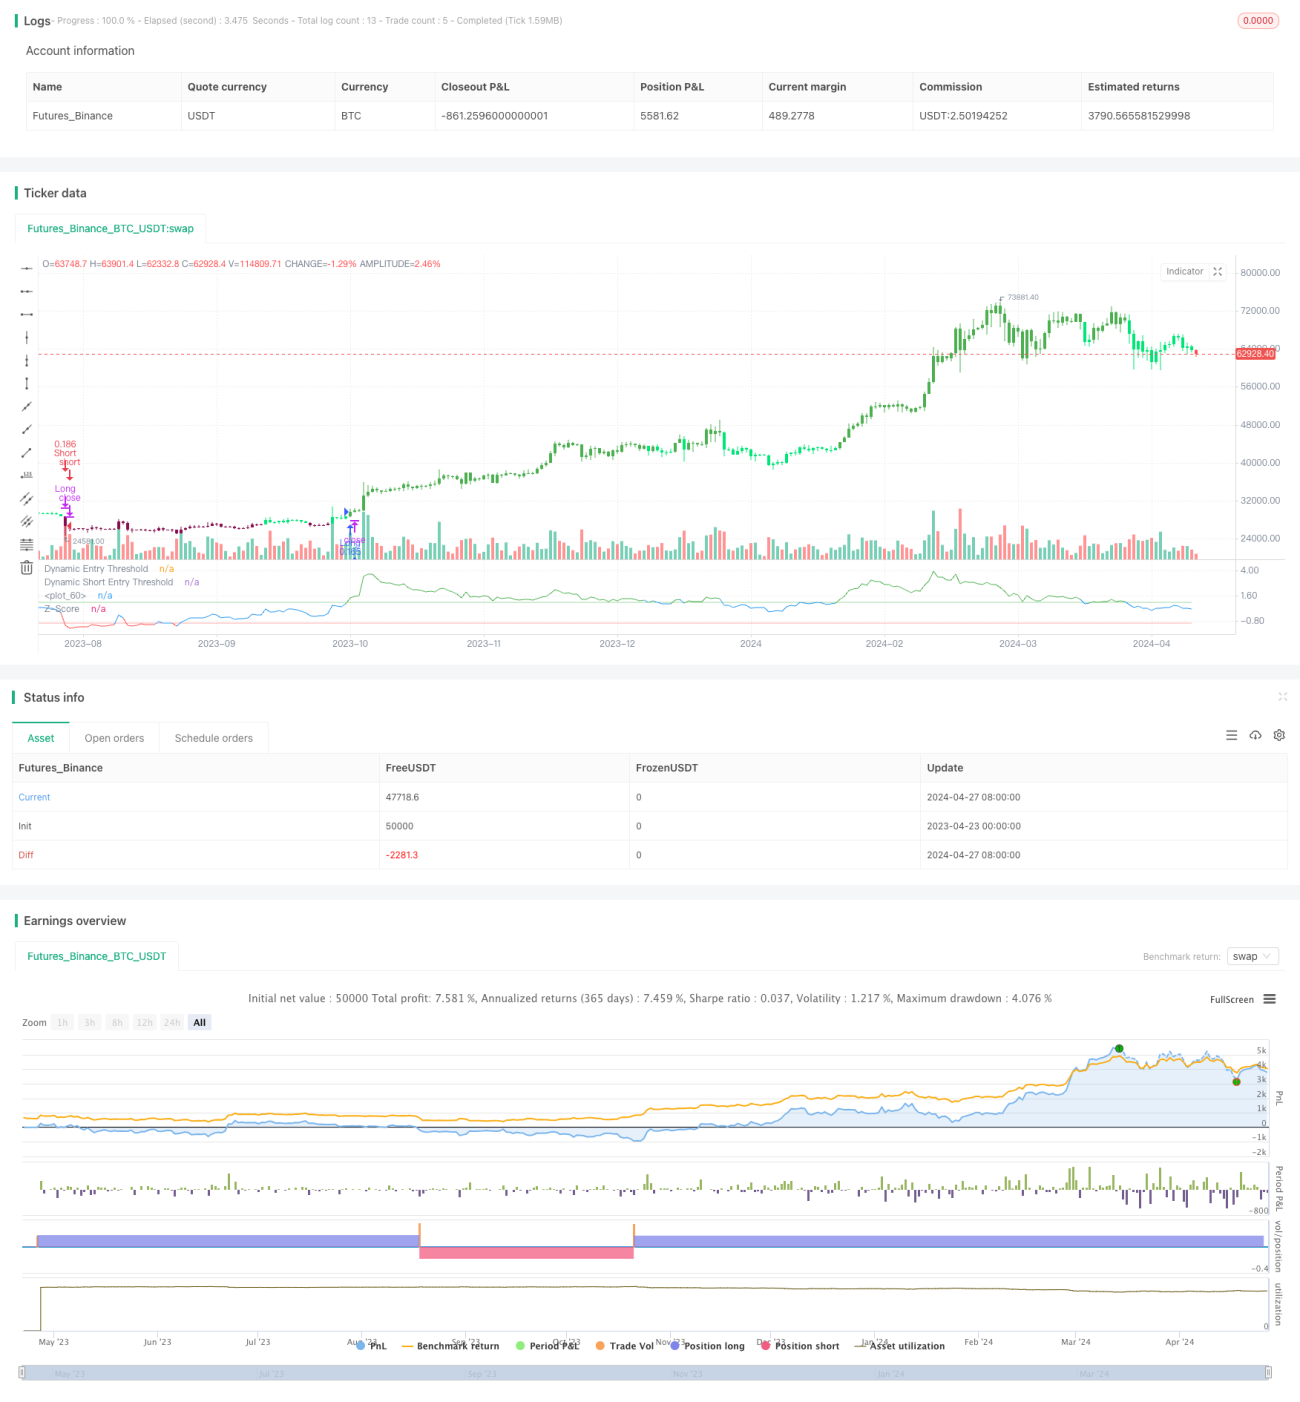
/*backtest
start: 2023-04-23 00:00:00
end: 2024-04-28 00:00:00
period: 1d
basePeriod: 1h
exchanges: [{"eid":"Futures_Binance","currency":"BTC_USDT"}]
*/

// This Pine Script™ code is subject to the terms of the Mozilla Public License 2.0 at https://mozilla.org/MPL/2.0/
// © PresentTrading

// This strategy employs a statistical approach by using a Z-score, which measures the deviation of the price from its moving average normalized by the standard deviation.- 1