Bollinger Bands Double Standard Deviation Filtering 5-Minute Quantitative Trading Strategy

Overview
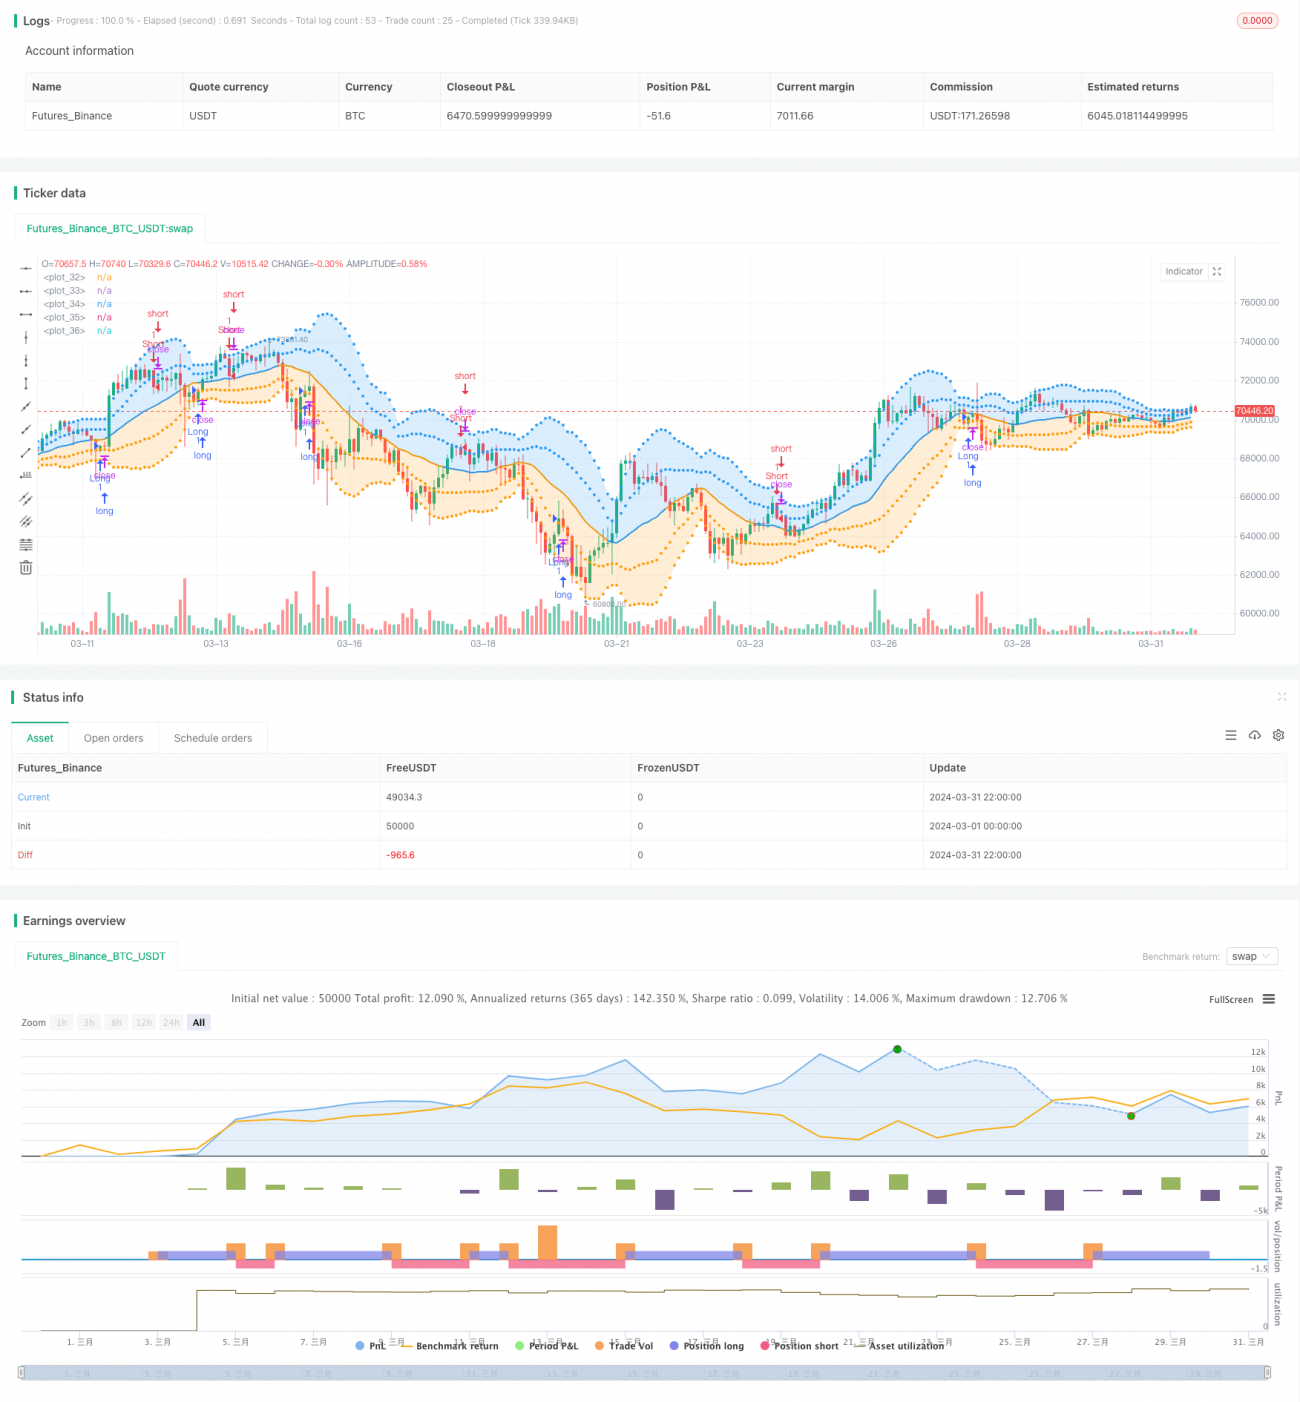
This strategy is based on the Bollinger Bands indicator and uses double standard deviation filtering to achieve fast trading on a 5-minute timeframe. It buys when the price breaks below the lower band and sells when it breaks above the upper band. The upper and lower bands are set by different standard deviations and marked with different colors, visually showing the strength of the trend.
Strategy Principle
- Calculate the Bollinger Bands baseline, upper band 1, upper band 2, lower band 1, and lower band 2.
- Generate a buy signal when the closing price crosses above the lower band 1 from below.
- Generate a sell signal when the closing price crosses below the upper band 1 from above.
- After buying, close the position when a sell signal appears. After selling, close the position when a buy signal appears.
- Upper band 2 and lower band 2 indicate trend strength and provide auxiliary judgment.
Strategy Advantages
- The double standard deviation setting improves the accuracy of trend judgment.
- The high trading frequency at the 5-minute level is suitable for fast in and out.
- Auxiliary judgment of trend strength helps with risk control.
- Adjustable parameters adapt to different markets.
Strategy Risks
- Frequent trading may lead to high commissions.
- Errors in trend judgment will bring losses.
- Lack of stop-loss measures exposes greater risks.
- Insufficient grasp of unilateral trends.
Strategy Optimization Directions
- Introduce stop-loss and take-profit mechanisms to control single transaction risks.
- Optimize Bollinger Bands parameters to improve trend capture ability.
- Add auxiliary indicators for trend judgment, such as MA, to increase win rate.
- Set filtering conditions for range-bound markets.
Summary
This strategy uses the statistical properties of Bollinger Bands, with double-layer filtering to enhance trend judgment, suitable for quickly capturing trend opportunities at the 5-minute level. However, issues with frequent trading and insufficient risk control measures still need optimization. In the future, improvements can continue to be made in terms of stop-loss and take-profit, parameter optimization, and auxiliary judgment to enhance overall robustness and profitability.
/*backtest
start: 2024-03-01 00:00:00
end: 2024-03-31 23:59:59
period: 2h
basePeriod: 15m
exchanges: [{"eid":"Futures_Binance","currency":"BTC_USDT"}]
*/

//@version=5
//This displays the traditional Bollinger Bands, the difference is
//that the 1st and 2nd StdDev are outlined with two colors and two
//different levels, one for each Standard Deviation- 1