Triple EMA Crossover Strategy

Overview
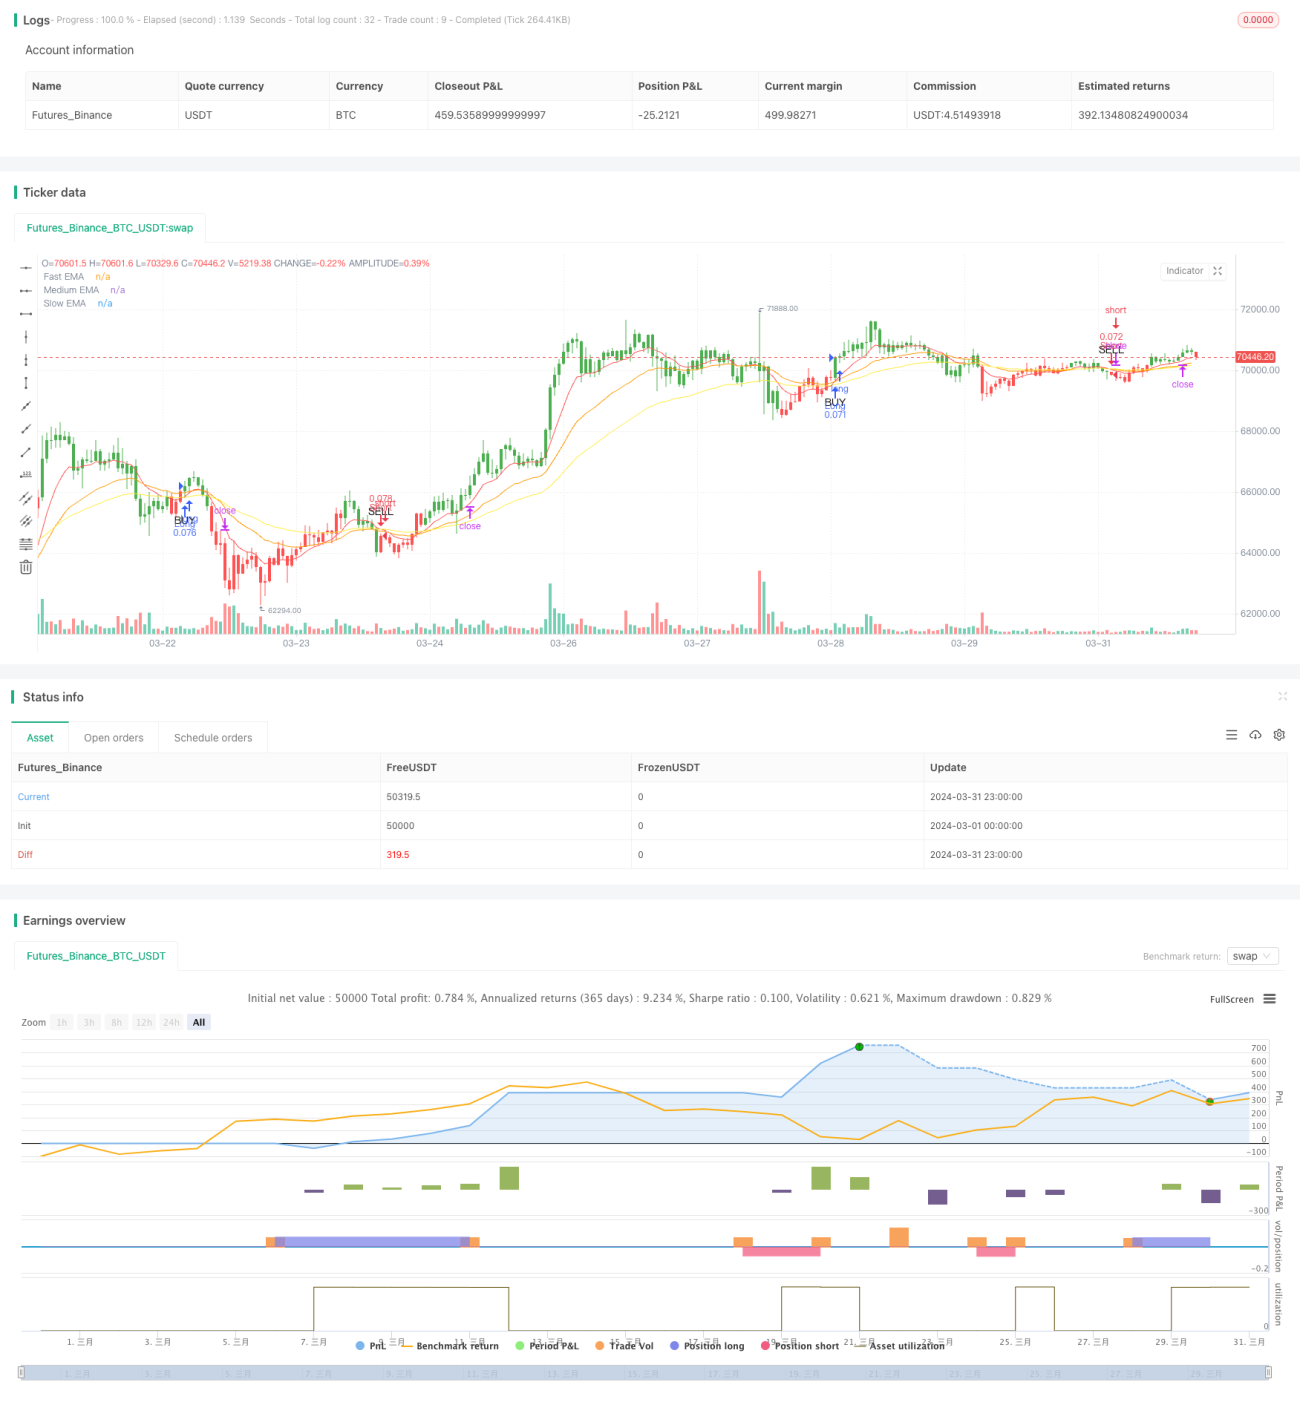
The Triple EMA Crossover Strategy is a trading strategy based on the crossover signals generated by three exponential moving averages (EMAs) with different periods. The strategy employs a fast EMA (10 periods), a medium EMA (25 periods), and a slow EMA (50 periods) to capture market trends while using the Average True Range (ATR) to set stop-loss and take-profit levels that adapt to different market volatility conditions. A bullish signal is generated when the fast EMA crosses above the slow EMA, and the medium EMA is also above the slow EMA; conversely, a bearish signal is triggered when the fast EMA crosses below the slow EMA, and the medium EMA is also below the slow EMA.
Strategy Principle
- Calculate three EMAs with different periods: fast (10), medium (25), and slow (50).
- Generate a bullish crossover signal when the fast EMA crosses above the slow EMA, and the medium EMA is above the slow EMA.
- Generate a bearish crossover signal when the fast EMA crosses below the slow EMA, and the medium EMA is below the slow EMA.
- Use ATR to calculate dynamic stop-loss and take-profit levels, setting the stop-loss at 3 times the ATR and the take-profit at 6 times the ATR.
- Enter a long position when a bullish crossover signal appears, setting the stop-loss and take-profit levels.
- Enter a short position when a bearish crossover signal appears, setting the stop-loss and take-profit levels.
Strategy Advantages
- The Triple EMA Crossover Strategy effectively filters out market noise and focuses on capturing major trends.
- By using EMAs with different periods, the strategy reacts more quickly to price changes while ensuring that signals are supported by medium to long-term trends.
- Utilizing ATR to dynamically adjust stop-loss and take-profit levels allows the strategy to adapt to different market volatility conditions, enhancing the effectiveness of risk management.
Strategy Risks
- In ranging or highly volatile markets, the strategy may generate false signals, leading to frequent trading and potential losses.
- The strategy's performance largely depends on the choice of EMA periods, and inappropriate parameter settings may result in decreased signal quality.
- Relying solely on moving average crossover signals may not provide a comprehensive market analysis, and the strategy should be used in conjunction with other technical indicators to confirm trends and signals.
Strategy Optimization Directions
- Consider incorporating other technical indicators, such as the Relative Strength Index (RSI) or Stochastic Oscillator, to validate the effectiveness of trends and crossover signals.
- Conduct parameter optimization tests for different market conditions and asset classes to identify the best combination of EMA periods and ATR multiplier settings.
- Introduce risk management measures, such as dynamically adjusting position sizes based on market volatility or halting trading under specific market conditions, to further control risks.
Summary
The Triple EMA Crossover Strategy offers traders an effective method for trend-following and risk management by leveraging crossover signals from exponential moving averages with different periods, combined with dynamic stop-loss and take-profit settings using ATR. Although the strategy performs well in trending markets, it may face challenges in ranging markets. Therefore, traders should consider combining it with other technical analysis tools and optimizing parameters for different market conditions and asset classes to enhance the strategy's reliability and profit potential.
/*backtest
start: 2024-03-01 00:00:00
end: 2024-03-31 23:59:59
period: 1h
basePeriod: 15m
exchanges: [{"eid":"Futures_Binance","currency":"BTC_USDT"}]
*/

//@version=5
strategy("Triple EMA Crossover Strategy", overlay=true, default_qty_type=strategy.percent_of_equity, default_qty_value=10)

// Input for EMA periods- 1