Overview
This strategy is a technical analysis-based trading strategy that uses support and resistance levels to make trading decisions. The strategy utilizes the pivothigh() and pivotlow() indicators to determine support and resistance levels. It goes long when the closing price is above the resistance level and goes short when the closing price is below the support level, and the previous high is also below the support level. Positions are closed when the price crosses the support or resistance levels in the opposite direction. The strategy is suitable for the Russian stock market and uses daily data.
Strategy Principle
- Use the request.security() function to obtain daily closing price data.
- Calculate support and resistance levels using the ta.pivothigh() and ta.pivotlow() functions with a 7-day time window.
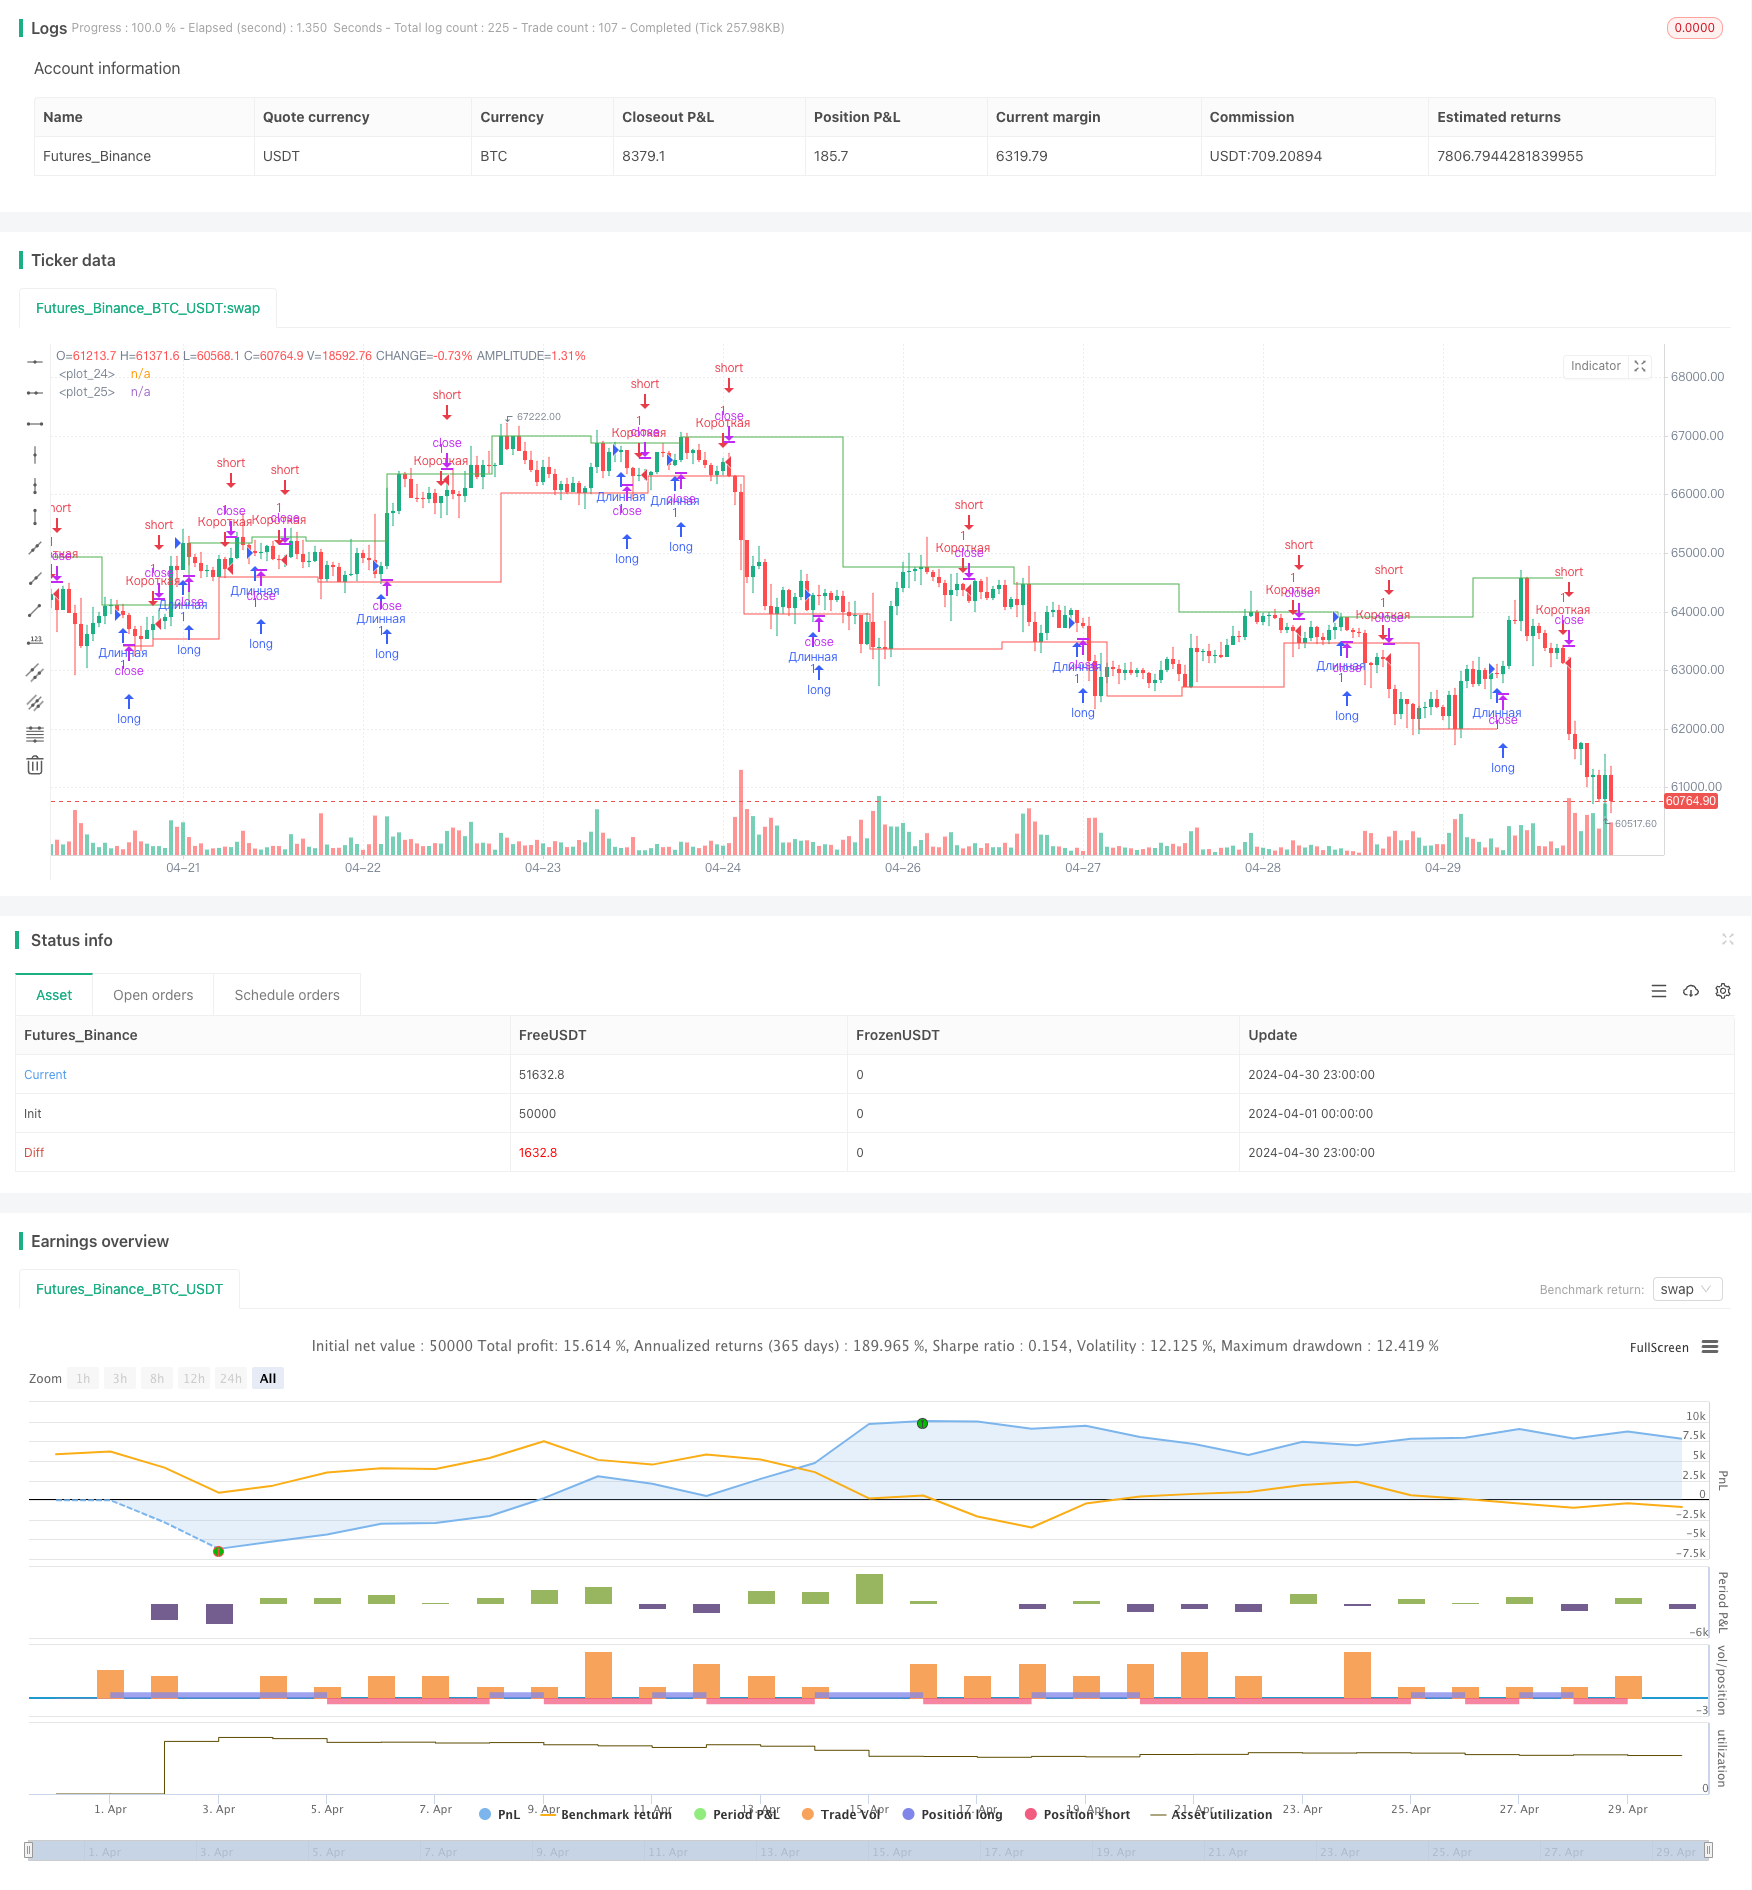
- Execute a long trade when the closing price is above the resistance level.
- Execute a short trade when the closing price is below the support level, and the previous high is also below the support level.
- Close all positions when the price crosses the support or resistance levels in the opposite direction.
- Plot support and resistance levels on the chart, represented by green and red colors.
Strategy Advantages
- The strategy is based on technical analysis and uses market price behavior to make trading decisions, suitable for trending markets.
- Support and resistance levels are widely recognized by market participants as important price levels. The strategy builds trading signals around these key levels, helping to capture trending opportunities.
- The strategy logic is clear, easy to understand and implement, making it suitable for beginners to learn and use.
- By plotting support and resistance levels on the chart, market structure and price behavior can be visually observed, aiding in trading decisions.
Strategy Risks
- The strategy relies entirely on historical price data and may fail when significant fundamental changes or black swan events occur in the market.
- Support and resistance levels may be breached, leading to consecutive losses for the strategy.
- The strategy lacks risk management measures, such as stop-loss and position sizing control, which may lead to substantial losses during extreme market volatility.
- The strategy may perform poorly in choppy markets, and frequent trading may result in high transaction costs.
Strategy Optimization Directions
- Introduce trend confirmation indicators, such as moving averages, to filter out noise and identify the main trend, improving signal quality.
- Set reasonable stop-loss levels to control individual trade risk and enhance strategy robustness.
- Optimize the calculation method for support and resistance levels, such as using a combination of multiple time scales, to improve the reliability of price levels.
- Incorporate position sizing and money management rules to dynamically adjust position sizes based on market volatility and control overall risk exposure.
- Perform parameter optimization and backtesting on the strategy to find the optimal parameter combination and improve strategy performance.
Summary
This strategy is a technical analysis-based trading strategy that uses support and resistance levels to generate trading signals. The strategy logic is straightforward, making it suitable for beginners to learn. However, when applying the strategy in practice, risk management and optimization need to be considered. By introducing other technical indicators, risk control measures, position sizing, and other enhancements, the robustness and profitability of the strategy can be further improved. Before deploying the strategy in a live trading environment, it is recommended to conduct comprehensive backtesting and parameter optimization on historical data.
/*backtest
start: 2024-04-01 00:00:00
end: 2024-04-30 23:59:59
period: 1h
basePeriod: 15m
exchanges: [{"eid":"Futures_Binance","currency":"BTC_USDT"}]
*/

//@version=5
strategy("Торговая стратегия от уровней", overlay=true)

// Функция для определения уровней поддержки и сопротивления
findSR() =>
    // Получаем данные для поиска уровней
    data = request.security(syminfo.tickerid, "D", close)
    // Находим уровни поддержки и сопротивления
    pivot_high = ta.pivothigh(data, 7, 7)
    pivot_low = ta.pivotlow(data, 7, 7)
    [pivot_high, pivot_low]

[support, resistance] = findSR()

// Условия входа в длинную позицию
longCondition = close > resistance
// Условия входа в короткую позицию
shortCondition = close < support and high[1] < support

// Условия выхода из позиции
exitCondition = close < resistance and close > support

// Отображение уровней поддержки и сопротивления на графике
plot(support, color=color.green, style=plot.style_stepline)
plot(resistance, color=color.red, style=plot.style_stepline)

// Вход в позицию
if (longCondition)
    strategy.entry("Длинная", strategy.long)
if (shortCondition)
    strategy.entry("Короткая", strategy.short)

// Выход из позиции
if (exitCondition)
    strategy.close("Длинная")
    strategy.close("Короткая")