Overview
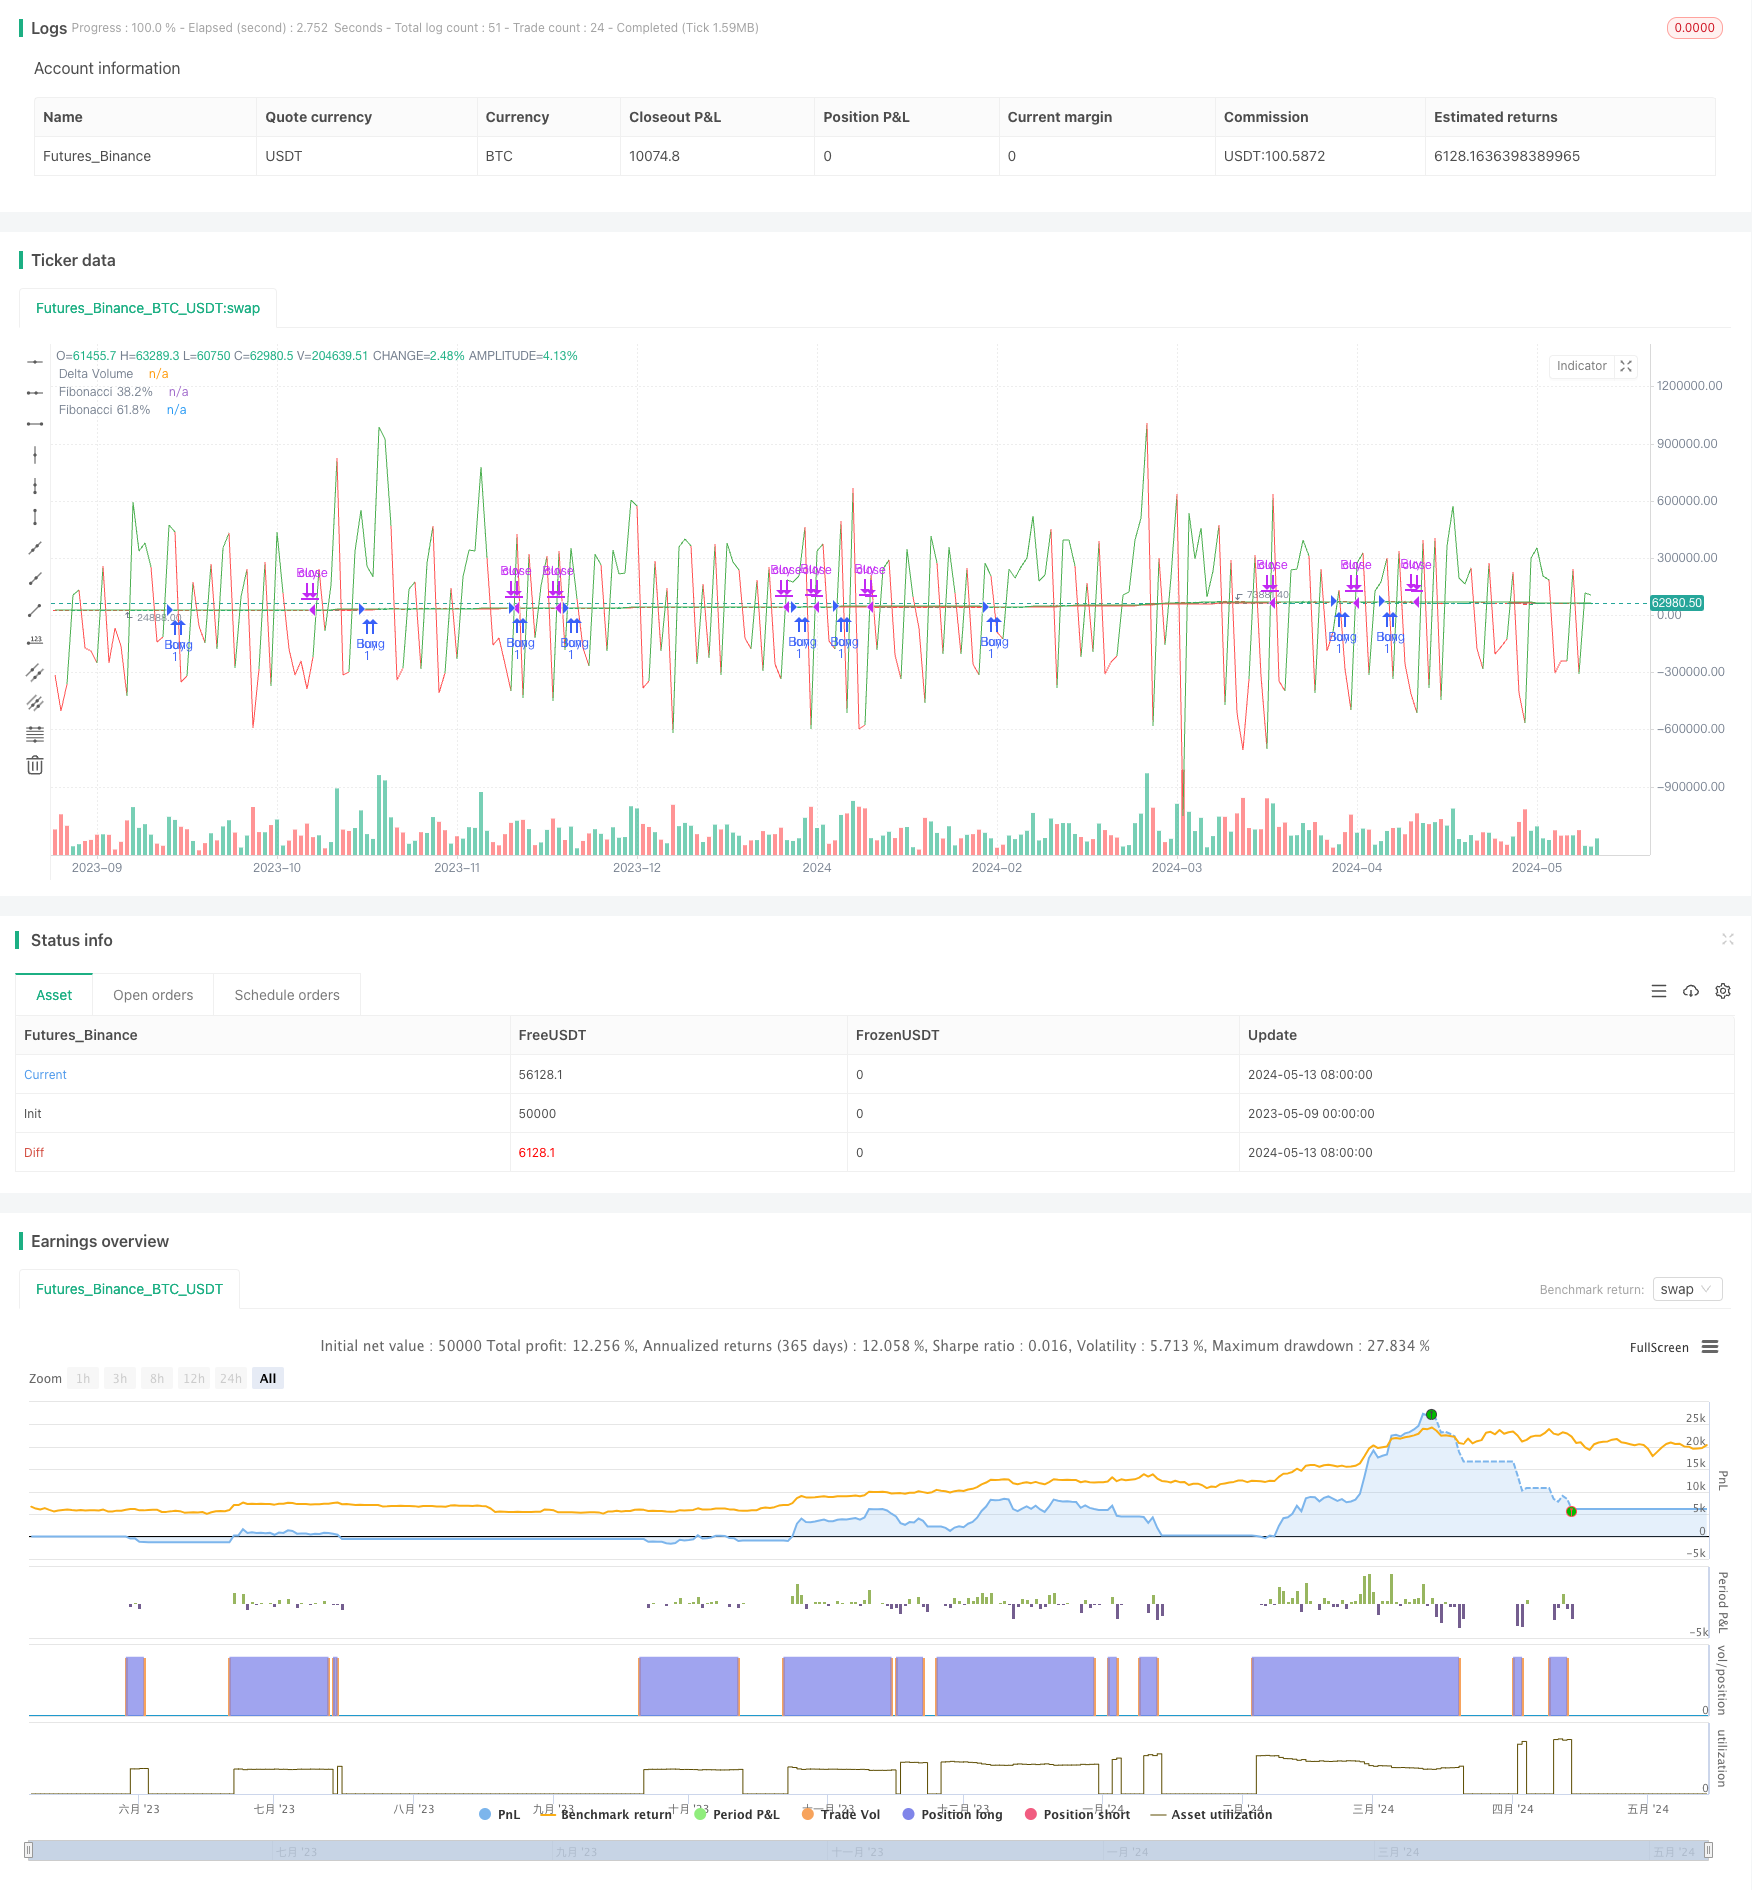
This strategy is a trading strategy based on Delta Volume and Fibonacci Retracement. It determines the market trend by comparing the volume of buyers and sellers over a period of time, while using Fibonacci retracement lines to determine entry and exit points. When the buyer’s volume exceeds the seller’s volume and the price breaks through the 61.8% Fibonacci retracement line, it enters a long position; when the seller’s volume exceeds the buyer’s volume and the price falls below the 38.2% Fibonacci retracement line, it closes the position.
Strategy Principle
- Calculate the buyer’s volume and seller’s volume for the specified period and store them in arrays.
- Calculate the Delta Volume, which is the buyer’s volume minus the seller’s volume.
- Calculate the highest and lowest prices for the specified period, and calculate the 38.2% and 61.8% Fibonacci retracement lines based on them.
- When the Delta Volume is greater than 0 (buyer’s volume is greater than seller’s volume) and the closing price is higher than the 61.8% Fibonacci retracement line, open a long position.
- When the Delta Volume is less than 0 (seller’s volume is greater than buyer’s volume) and the closing price is lower than the 38.2% Fibonacci retracement line, close the position.
Strategy Advantages
- By combining volume and price dimensions, it can more comprehensively judge the market trend.
- Using Fibonacci retracement lines as entry and exit points has clear technical support.
- Delta Volume indicator can reflect the supply and demand relationship in the market, which is a leading indicator.
- Parameters are adjustable and applicable to different markets and trading varieties.
Strategy Risks
- In the oscillating market, frequent entries and exits may lead to higher transaction costs.
- If the market fluctuates drastically, prices may quickly break through Fibonacci retracement lines, leading to missing the best entry and exit points.
- The strategy relies on historical data for calculation. For newly listed trading varieties or data missing situations, it may affect the effectiveness of the strategy.
Strategy Optimization Direction
- Consider introducing other technical indicators, such as moving averages, RSI, etc., to confirm trends and entry/exit points.
- For different markets and trading varieties, optimize the calculation period and parameters of Delta Volume and Fibonacci Retracement.
- After entering a position, set a trailing stop loss or take profit to control risk and lock in profits.
- Combine with market sentiment indicators, such as the Fear & Greed Index, to dynamically adjust the strategy.
Summary
By combining Delta Volume and Fibonacci Retracement lines, this strategy enters when a trend is forming and exits when the trend may reverse, in order to capture the main trend of the market. However, it may face the risk of frequent trading in the oscillating market, so it needs to be optimized with other indicators and risk control measures. Overall, the strategy is clear in thought, logically rigorous, and can be used as a basic strategy for further development and application.
/*backtest
start: 2023-05-09 00:00:00
end: 2024-05-14 00:00:00
period: 1d
basePeriod: 1h
exchanges: [{"eid":"Futures_Binance","currency":"BTC_USDT"}]
*/

//@version=5
strategy("Delta Volume with Fibonacci Levels Strategy", overlay=true)

// Input pour la période de calcul du volume et du delta
N = input(14, title="Période du Delta Volume")
fibLength = input(21, title="Fibonacci Lookback Period")

// Choix de la barre pour l'entrée et la sortie des trades
entryPriceType = input.string("close", title="Entry Price Type", options=["open", "close"])
exitPriceType = input.string("close", title="Exit Price Type", options=["open", "close"])

// Correction des dates de début et de fin pour le backtest
startDate = input(defval = timestamp("2021-01-01"), title = "Start Date")
endDate = input(defval = timestamp("2022-01-01"), title = "End Date")

// Calcul des volumes des acheteurs et des vendeurs
buyerVolume = array.new_float()
sellerVolume = array.new_float()

// Mise à jour des volumes à chaque bougie
buyVol = close > open ? volume : 0
sellVol = close < open ? volume : 0
array.unshift(buyerVolume, buyVol)
array.unshift(sellerVolume, sellVol)

// Gardez seulement les N dernières valeurs pour le delta volume
if array.size(buyerVolume) > N
    array.pop(buyerVolume)
if array.size(sellerVolume) > N
    array.pop(sellerVolume)

// Calcul du delta de volume
sumBuyerVolume = array.sum(buyerVolume)
sumSellerVolume = array.sum(sellerVolume)
deltaVolume = sumBuyerVolume - sumSellerVolume

// Calcul du plus haut et du plus bas pour Fibonacci
highestPrice = ta.highest(high, fibLength)
lowestPrice = ta.lowest(low, fibLength)

// Fibonacci Levels
fib382 = lowestPrice + (highestPrice - lowestPrice) * 0.5
fib618 = lowestPrice + (highestPrice - lowestPrice) * 0.786


// Vérification des dates pour le backtest
bool isInDateRange = true

// Conditions d'entrée et de sortie
entryPrice = entryPriceType == "open" ? open : close
exitPrice = exitPriceType == "open" ? open : close

// Acheter quand le volume des acheteurs dépasse celui des vendeurs, le prix est au-dessus du niveau 61.8% de Fibonacci
if isInDateRange and deltaVolume > 0 and entryPrice > fib618
    strategy.entry("Buy", strategy.long)

// Vendre quand le volume des vendeurs dépasse celui des acheteurs, le prix est en dessous du niveau 38.2% de Fibonacci
if isInDateRange and deltaVolume < 0 and exitPrice < fib382
    strategy.close("Buy")

// Affichage des niveaux de Fibonacci et du delta de volume
plot(fib382, color=color.red, title="Fibonacci 38.2%")
plot(fib618, color=color.green, title="Fibonacci 61.8%")
plot(deltaVolume, color=deltaVolume > 0 ? color.green : color.red, title="Delta Volume")