SR Breakout Strategy

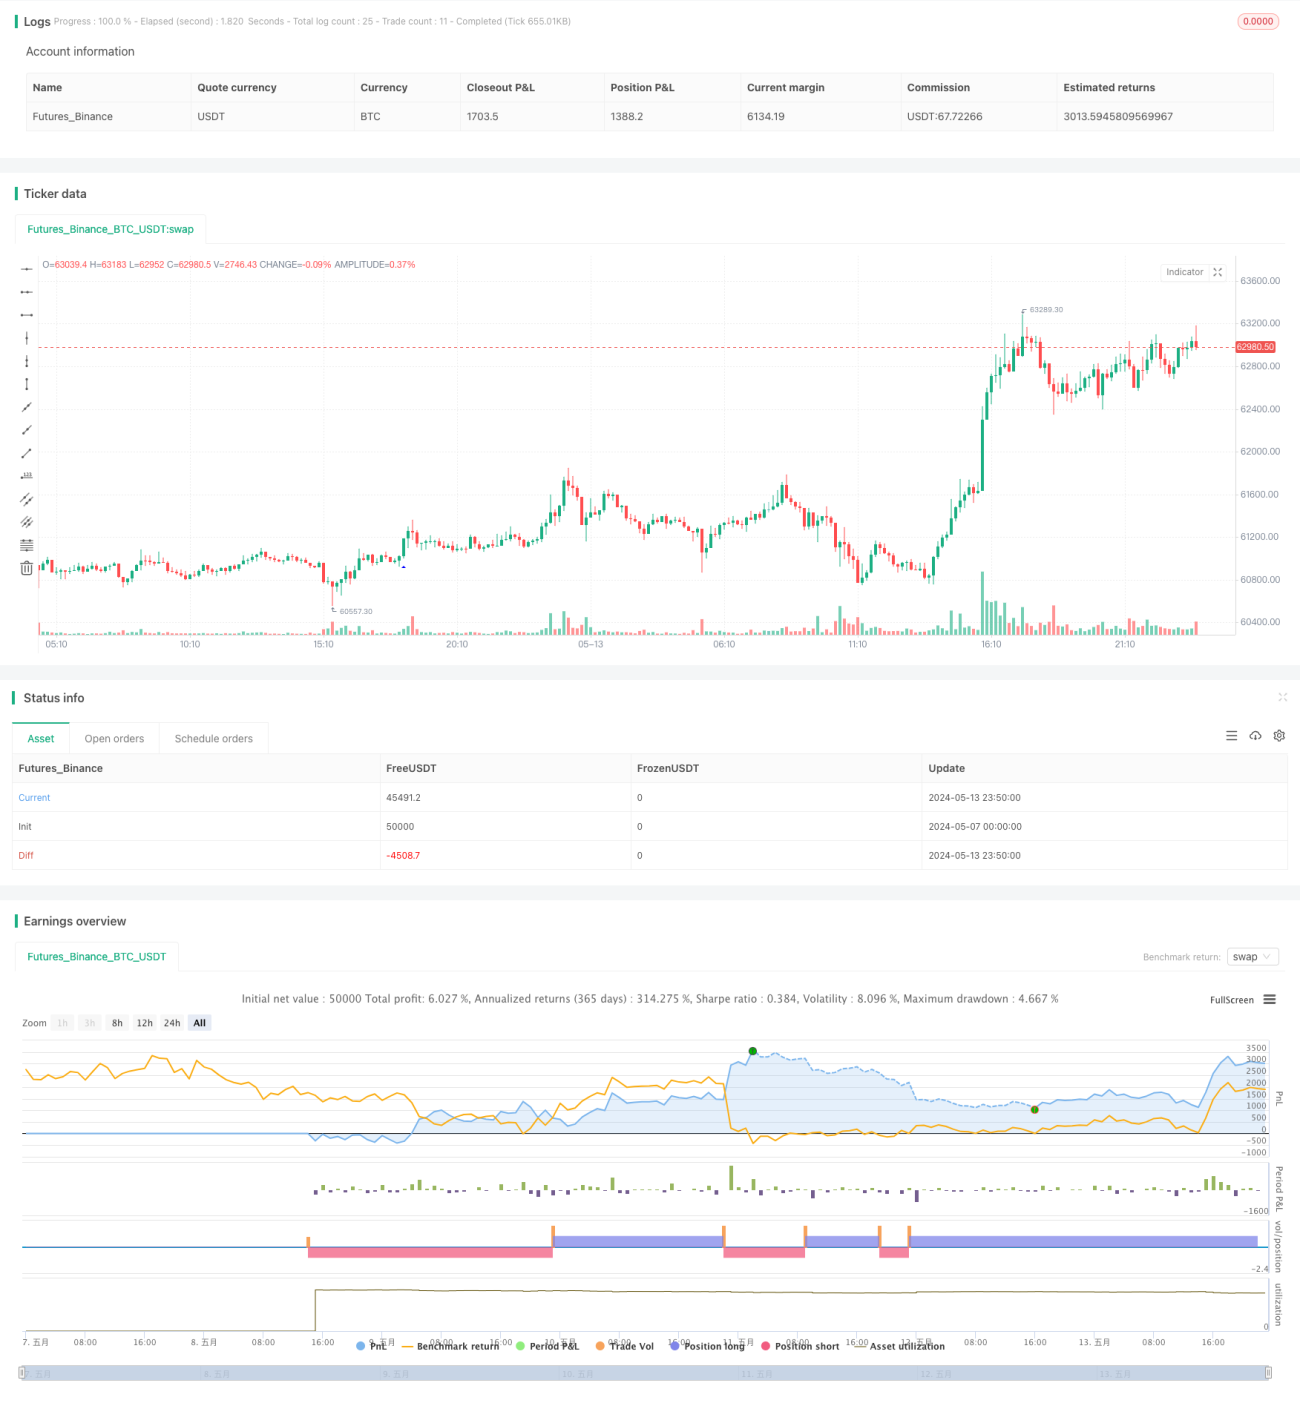
Overview
The SR Breakout Strategy is a support and resistance breakout strategy developed based on LonesomeTheBlue's breakout finder indicator. The main idea of this strategy is to generate long or short signals by judging whether the closing price breaks through the support or resistance level. The default settings are based on the 8-hour candlestick chart, but there are more optimal parameter settings on the 4-hour candlestick chart. This strategy uses the pivothigh and pivotlow functions to determine support and resistance levels, and uses the highest and lowest prices to determine breakouts. At the same time, this strategy also sets stop loss and take profit.
Strategy Principle
- Use the pivothigh and pivotlow functions to calculate the highs and lows over a certain period of time and store them in arrays.
- Determine whether the current closing price is higher than the resistance level. If so, it is judged as a bullish breakout and a long signal is generated.
- Determine whether the current closing price is lower than the support level. If so, it is judged as a bearish breakout and a short signal is generated.
- After generating a trading signal, calculate the stop loss and take profit prices based on the set stop loss and take profit ratios, and set the corresponding stop loss and take profit orders.
- Draw the corresponding breakout range according to the breakout direction.
Strategy Advantages
- Support and resistance breakout is a classic trading strategy with a certain practical basis.
- By using the pivothigh and pivotlow functions to calculate support and resistance levels, breakout opportunities can be captured relatively accurately.
- The code structure of this strategy is clear, and by storing highs and lows in arrays, it is convenient for backtesting and optimization.
- Stop loss and take profit are set, which can control risks relatively well.
Strategy Risks
- The support and resistance breakout strategy performs poorly in choppy markets and is prone to frequent false breakouts.
- Fixed stop loss and take profit ratios may not be able to adapt to different market conditions, resulting in an imbalance of risk and return.
- This strategy only considers price factors and does not consider other important indicators such as trading volume, which may miss some important signals.
Strategy Optimization Direction
- Consider introducing more technical indicators, such as trading volume, MACD, etc., to improve the accuracy and reliability of signals.
- For stop loss and take profit, consider using trailing stop or dynamic stop loss and take profit ratios to better adapt to different market conditions.
- Consider introducing filtering conditions, such as trend filtering, volatility filtering, etc., to reduce false breakouts in choppy markets.
- Consider optimizing support and resistance levels, such as using adaptive periods, introducing Fibonacci levels, etc.
Summary
The SR Breakout Strategy is a trading strategy based on the classic idea of support and resistance breakout. By using the pivothigh and pivotlow functions to calculate support and resistance levels, and by judging whether the closing price breaks through these levels to generate trading signals. The advantage of this strategy is that the idea is clear and easy to implement and optimize; at the same time, there are also some risks, such as poor performance in choppy markets, and the risks that may be brought about by fixed stop loss and take profit ratios. In the future, we can consider optimizing and improving this strategy from aspects such as technical indicators, stop loss and take profit, filtering conditions, support and resistance optimization, etc., to improve its stability and profitability.
/*backtest
start: 2024-05-07 00:00:00
end: 2024-05-14 00:00:00
period: 10m
basePeriod: 1m
exchanges: [{"eid":"Futures_Binance","currency":"BTC_USDT"}]
*/

// This source code is subject to the terms of the Mozilla Public License 2.0 at https://mozilla.org/MPL/2.0/
// © LonesomeTheBlue © chanu_lev10k

//@version=5- 1