Ichimoku Cloud and Moving Average Strategy

Overview
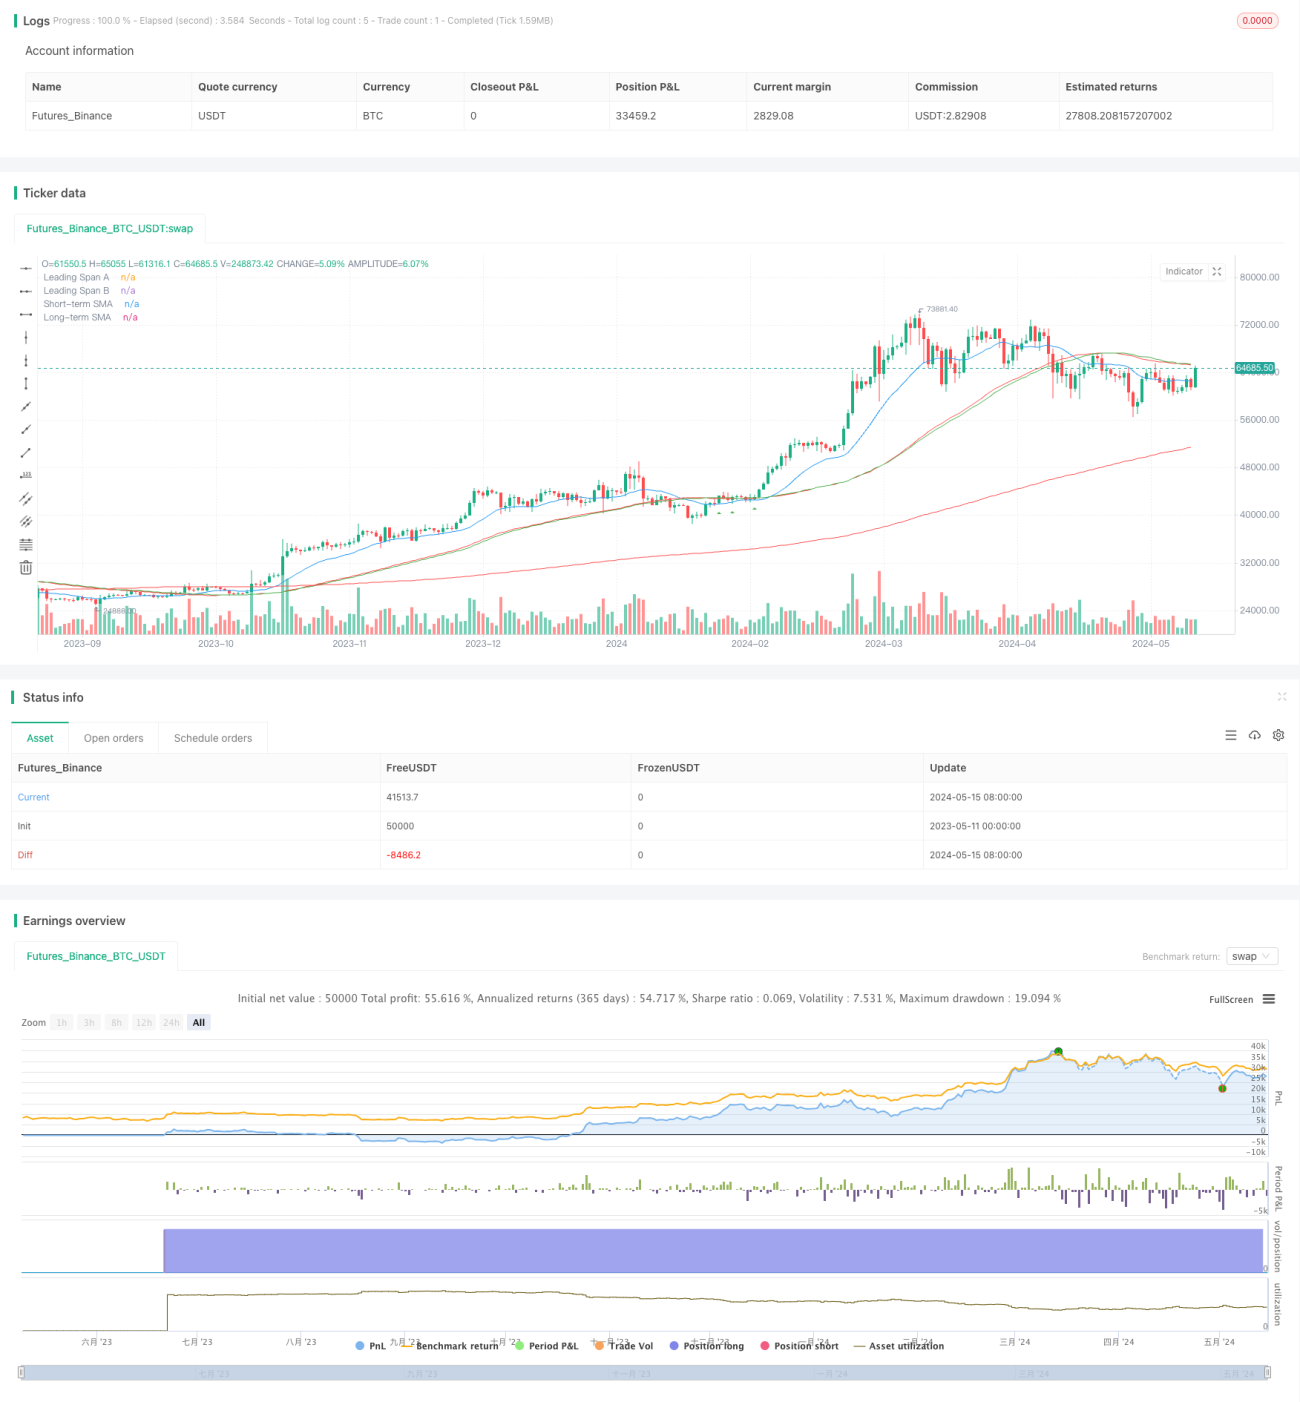
This strategy combines the Ichimoku Cloud, short-term (55) and long-term (200) Simple Moving Averages (SMA) to identify potential buy and sell signals. Buy signals require the price to be above the cloud and long-term SMA, and to retest the short-term SMA after crossing above it. Sell signals require the price to be below the cloud and long-term SMA, and to retest the short-term SMA after crossing below it. The strategy avoids generating signals during ranging markets or high news events, as these periods tend to have more fake-outs. Backtesting shows the strategy performs best on the 1-hour and 2-hour timeframes.
Strategy Principles
The strategy is based on the following principles:
- When price is above the cloud and long-term SMA, the market is in an uptrend.
- When price is below the cloud and long-term SMA, the market is in a downtrend.
- Crossovers of the short-term SMA confirm trends, and retests of the short-term SMA provide low-risk entry opportunities.
- Ranging markets and high news events have more fake-outs and should be avoided.
The code first calculates the required Ichimoku Cloud components (Conversion Line, Base Line, Leading Span A and B), as well as the short-term and long-term SMAs. It then defines multiple conditions to identify the price position relative to the cloud and moving averages. When all buy/sell conditions are met, the code generates buy and sell signals respectively.
Strategy Advantages
- Combines multiple indicators to confirm trends, improving signal reliability. The Ichimoku Cloud filters out noise, while SMA crossovers confirm trends.
- Seeks low-risk entry opportunities on retests of moving averages within confirmed trends.
- Further reduces fake-out risks by avoiding trades during ranging markets and high news events.
- Suitable for medium to long-term trading on 1-hour and 2-hour timeframes, capturing big trends with large profit potential.
Strategy Risks
- Losses may occur during trend reversals. Although moving average crossovers and cloud breakouts confirm trends, they still lag.
- Lacks clear stop-loss levels. Current conditions focus on entry timing but do not define specific exit points.
- Parameter selection is subjective and uncertain. Different choices of cloud parameters, moving average lengths, etc. will affect strategy performance.
Strategy Optimization Directions
- Introduce clear stop-loss levels, such as previous high/low breaches, ATR multiples, etc., to reduce single trade risk.
- Cross-reference with other trend confirmation indicators, such as MACD, DMI, etc., to form more robust signal combinations.
- Optimize parameters to find the best combination that improves the strategy's adaptability to various market conditions.
- Differentiate between trending and ranging markets, actively enter positions in trends while reducing trading frequency in ranges.
Summary
The "Ichimoku Cloud and Moving Average Strategy" seeks low-risk entry opportunities by combining the Ichimoku Cloud with Simple Moving Averages within established trends. By filtering out trades during ranging markets and high news events, the strategy reduces fake-out risks and improves overall performance. It is mainly suitable for medium to long-term traders and performs well on 1-hour and 2-hour timeframes. However, there is still room for further optimization, such as introducing clear stop-losses, optimizing signal combinations, and tuning parameters, to achieve more robust strategy performance.
- 1