SMC & EMA Strategy with P&L Projections

Overview
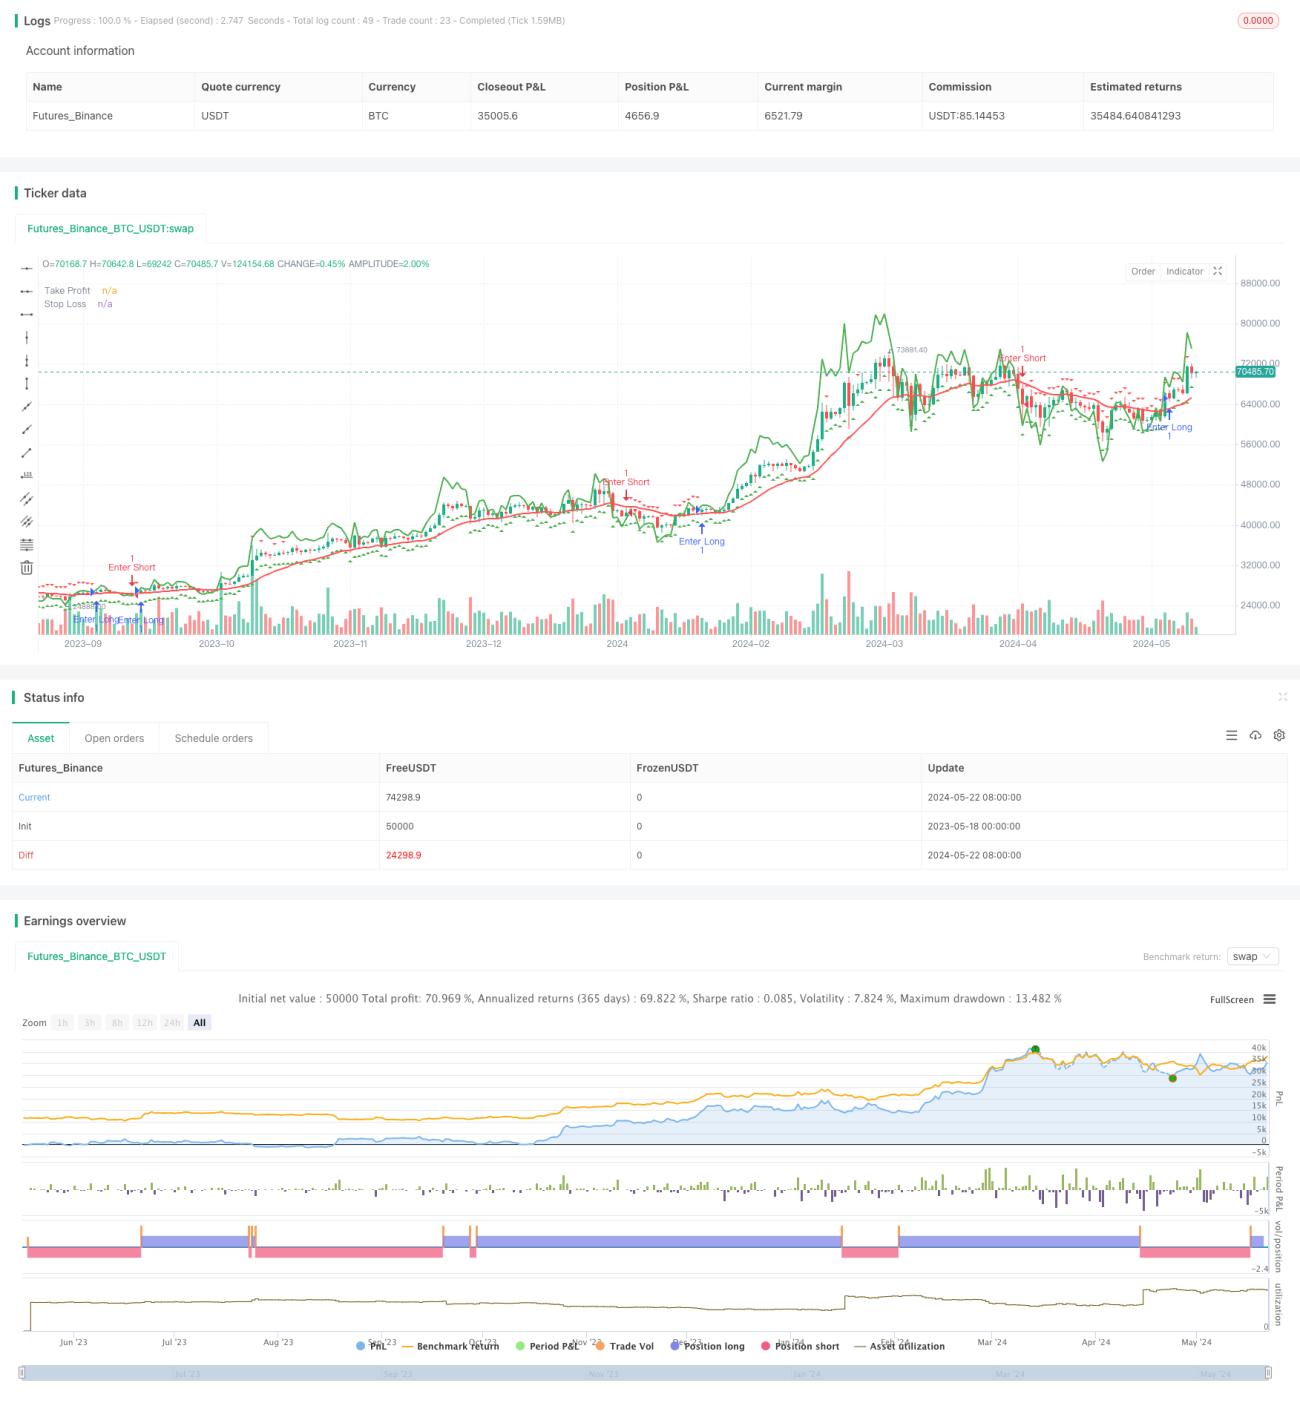
This strategy uses two exponential moving averages (EMAs) with different periods to determine the current market trend. When the fast EMA is above the slow EMA, it is considered a bullish trend, and conversely, when the fast EMA is below the slow EMA, it is considered a bearish trend. Additionally, the strategy calculates the risk-to-reward ratio and sets take profit and stop loss levels to help optimize risk management in trading.
Strategy Principle
The core principle of this strategy is to utilize EMAs with different periods to capture market trends. When the fast EMA (period of 10) is above the slow EMA (period of 20), the market is considered to be in an uptrend, and the strategy generates a buy signal. Conversely, when the fast EMA is below the slow EMA, the market is considered to be in a downtrend, and the strategy generates a sell signal.
Apart from trend identification, the strategy also introduces the concept of risk management. It evaluates the potential risk and reward of each trade by calculating the risk-to-reward ratio. Moreover, the strategy calculates take profit and stop loss levels based on the position of the EMAs to help limit potential losses and lock in profits.
Strategy Advantages
- Simple and effective: The strategy uses simple EMA crossovers to determine trends, making it easy to understand and implement.
- Risk management: By calculating the risk-to-reward ratio and setting take profit and stop loss levels, the strategy helps optimize risk management.
- Adaptability: The strategy can be adapted to different market conditions by adjusting the EMA periods and risk-to-reward ratio thresholds.
Strategy Risks
- False signals: In choppy markets or at trend turning points, EMA crossovers may generate false signals, leading to incorrect trading decisions.
- Lag: As a trend-following strategy, EMA crossovers may generate signals after the trend has already been established, missing early trading opportunities.
- Fixed stop loss: The strategy uses fixed stop loss levels, which may lead to frequent stop-outs in highly volatile markets, impacting strategy performance.
Strategy Optimization Directions
- Incorporate other indicators: Combine other technical indicators such as RSI, MACD, etc., to improve the reliability and accuracy of signals.
- Dynamic stop loss: Adjust stop loss levels dynamically based on market volatility or indicators like ATR to better adapt to market changes.
- Parameter optimization: Through backtesting and optimization, find the optimal EMA periods and risk-to-reward ratio thresholds to enhance strategy performance.
Summary
This strategy uses EMA crossovers to identify trends and introduces risk management concepts, providing traders with a simple yet effective trading framework. Although the strategy may face risks such as false signals and lag, further improvements can be made by incorporating other indicators, implementing dynamic stop losses, and optimizing parameters. Overall, it is a strategy worth further research and optimization.
- 1