Trend Reversal Trading Strategy Based on RSI Divergence

Overview
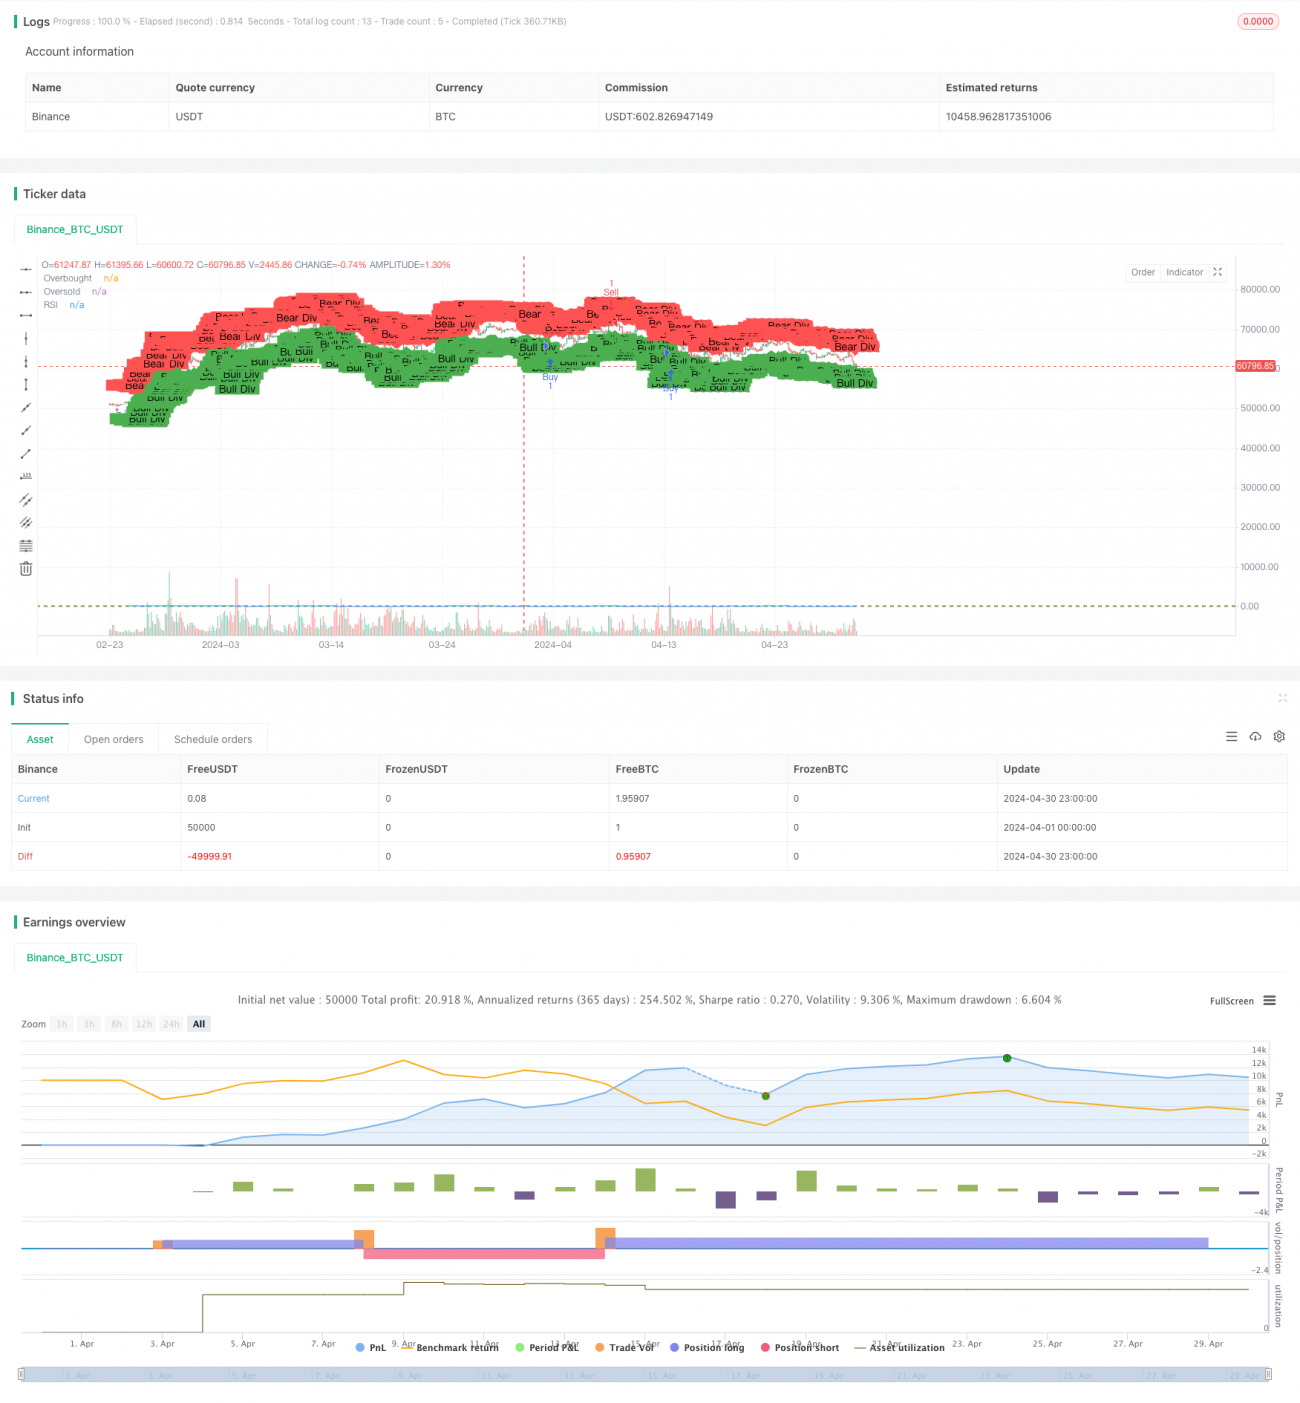
This trading strategy is based on the divergence between the Relative Strength Index (RSI) and price movements, aiming to capture potential trend reversal opportunities. The strategy detects both bullish and bearish divergences and generates buy and sell signals accordingly. When a divergence occurs between RSI and price, it indicates that the current trend may be about to reverse, providing traders with potential trading opportunities.
Strategy Principles
- Calculate the RSI indicator for a specified period.
- Determine the presence of bullish or bearish divergence by comparing price and RSI movements over a certain lookback period.
- Bullish divergence: Price makes a new low, but RSI fails to make a new low, indicating accumulating upward momentum.
- Bearish divergence: Price makes a new high, but RSI fails to make a new high, indicating accumulating downward momentum.
- Generate a buy signal when bullish divergence is detected and RSI crosses above the oversold threshold.
- Generate a sell signal when bearish divergence is detected and RSI crosses below the overbought threshold.
Strategy Advantages
- Capturing trend reversals: By identifying divergences between RSI and price, the strategy can generate trading signals early in the trend reversal process, providing traders with opportunities to position themselves ahead of the curve.
- Simplicity and ease of use: The strategy is based on the classic RSI indicator, which is simple to calculate and has parameters that are easy to understand and adjust, making it suitable for various types of traders.
- Applicability to multiple markets: The RSI divergence strategy can be applied to various financial markets, such as stocks, futures, and forex, demonstrating its broad applicability.
Strategy Risks
- False signals: Not all RSI divergences lead to actual trend reversals, and false signals may occur, resulting in trading losses.
- Lagging nature: RSI divergences often occur in the early stages of a trend reversal, but not all divergence signals immediately trigger a trend reversal, potentially leading to a certain degree of lag.
- Parameter sensitivity: The strategy's performance may be sensitive to parameters such as the RSI calculation period and overbought/oversold thresholds, and different parameter settings may result in different trading outcomes.
Strategy Optimization Directions
- Combining with other indicators: Integrate the RSI divergence strategy with other technical indicators (e.g., moving averages, MACD) to improve the reliability of signal confirmation.
- Dynamic parameter adjustment: Dynamically adjust parameters such as the RSI calculation period and overbought/oversold thresholds based on market conditions and asset characteristics to adapt to different market environments.
- Incorporating risk management: Introduce stop-loss and take-profit mechanisms into the strategy to control individual trade risk and improve risk-adjusted returns.
- Multi-timeframe analysis: Analyze RSI divergences on different time frames (e.g., daily, 4-hour) to capture trend reversal opportunities at various levels.
Summary
The trend reversal trading strategy based on RSI divergence aims to capture potential trend reversal opportunities by identifying divergences between the RSI indicator and price movements. The strategy is simple to use and applicable to multiple financial markets. However, traders need to be aware of risks such as false signals, lagging nature, and parameter sensitivity. By combining with other indicators, dynamically adjusting parameters, incorporating risk management, and conducting multi-timeframe analysis, the strategy's robustness and profit potential can be further enhanced.
- 1