RSI+Supertrend Trend-Following Trading Strategy

Overview
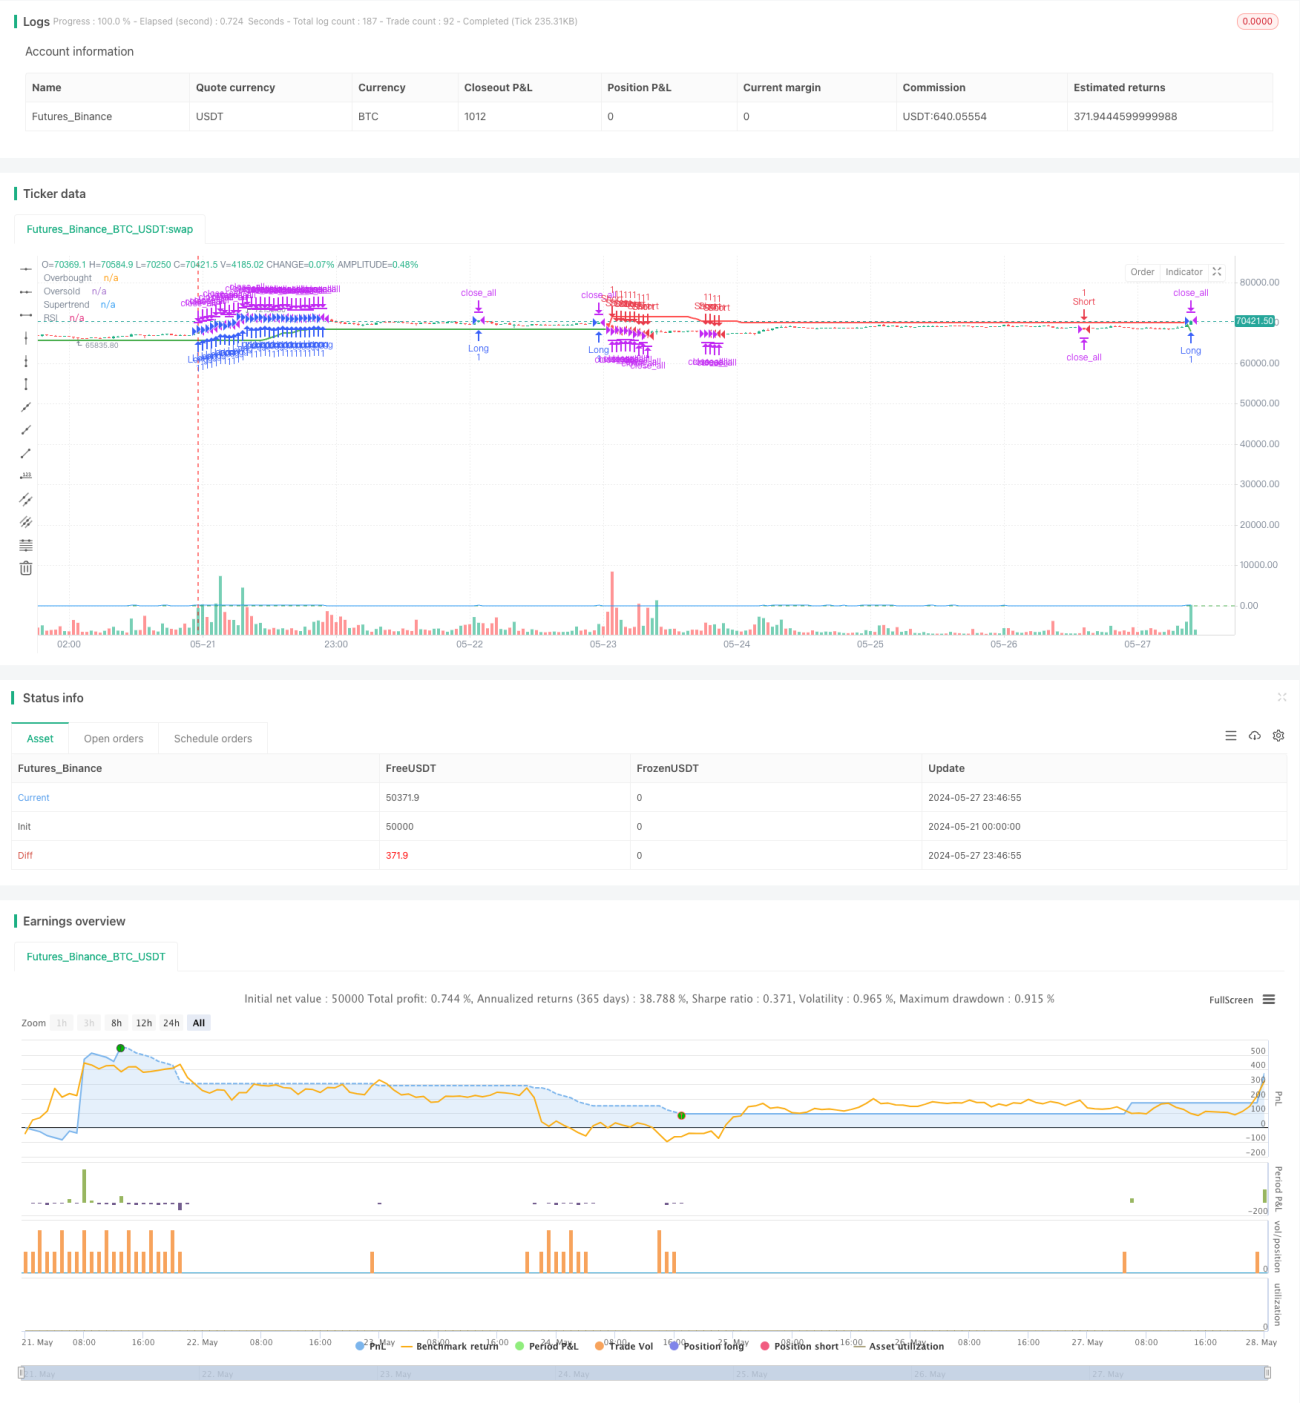
This strategy combines the Relative Strength Index (RSI) and Supertrend technical indicators to capture market trends and identify potential trading opportunities. The main idea behind the strategy is to use RSI to determine overbought and oversold market conditions while using the Supertrend indicator to confirm the trend direction. When both RSI and Supertrend indicators satisfy specific conditions simultaneously, the strategy generates buy or sell signals.
Strategy Principles
- Calculate the values of RSI and Supertrend indicators.
- When RSI crosses above 58 and the Supertrend indicator shows green, generate a buy signal and open a long position.
- When RSI crosses below 50 and the Supertrend indicator turns red, close the long position.
- When RSI crosses below 38 and the Supertrend indicator shows red, generate a sell signal and open a short position.
- When RSI crosses above 45 and the Supertrend indicator turns green, close the short position.
Advantage Analysis
- Combines a momentum indicator (RSI) and a trend indicator (Supertrend), effectively capturing market trends.
- RSI helps identify overbought and oversold market conditions, avoiding trades in extreme situations.
- The Supertrend indicator provides clear trend direction signals, aiding in making correct trading decisions.
- The strategy logic is clear and easy to understand and implement.
Risk Analysis
- In a oscillating market, frequent trading signals may lead to excessive trading frequency and transaction costs.
- RSI and Supertrend indicators may generate conflicting signals, reducing the strategy's effectiveness.
- The strategy relies on fixed parameter settings, which may not adapt to different market environments.
Optimization Directions
- Consider incorporating other technical indicators, such as moving averages, to improve the strategy's reliability.
- Optimize the parameters of RSI and Supertrend to adapt to different market conditions.
- Implement risk management measures, such as stop-loss and position sizing, to control potential losses.
- Backtest and monitor the strategy in real-time, adjusting strategy parameters as needed.
Summary
The RSI+Supertrend Trend-Following Trading Strategy effectively captures market trends and generates trading signals by combining the RSI and Supertrend technical indicators. The strategy's advantages lie in its clear logic, ease of implementation, and consideration of both momentum and trend factors. However, the strategy also has some risks, such as frequent trading and limitations in parameter settings. To further improve the strategy's performance, one can consider introducing other indicators, optimizing parameters, strengthening risk management measures, and continuously monitoring and adjusting the strategy.
- 1