VWAP and Super Trend Buy/Sell Strategy

Overview
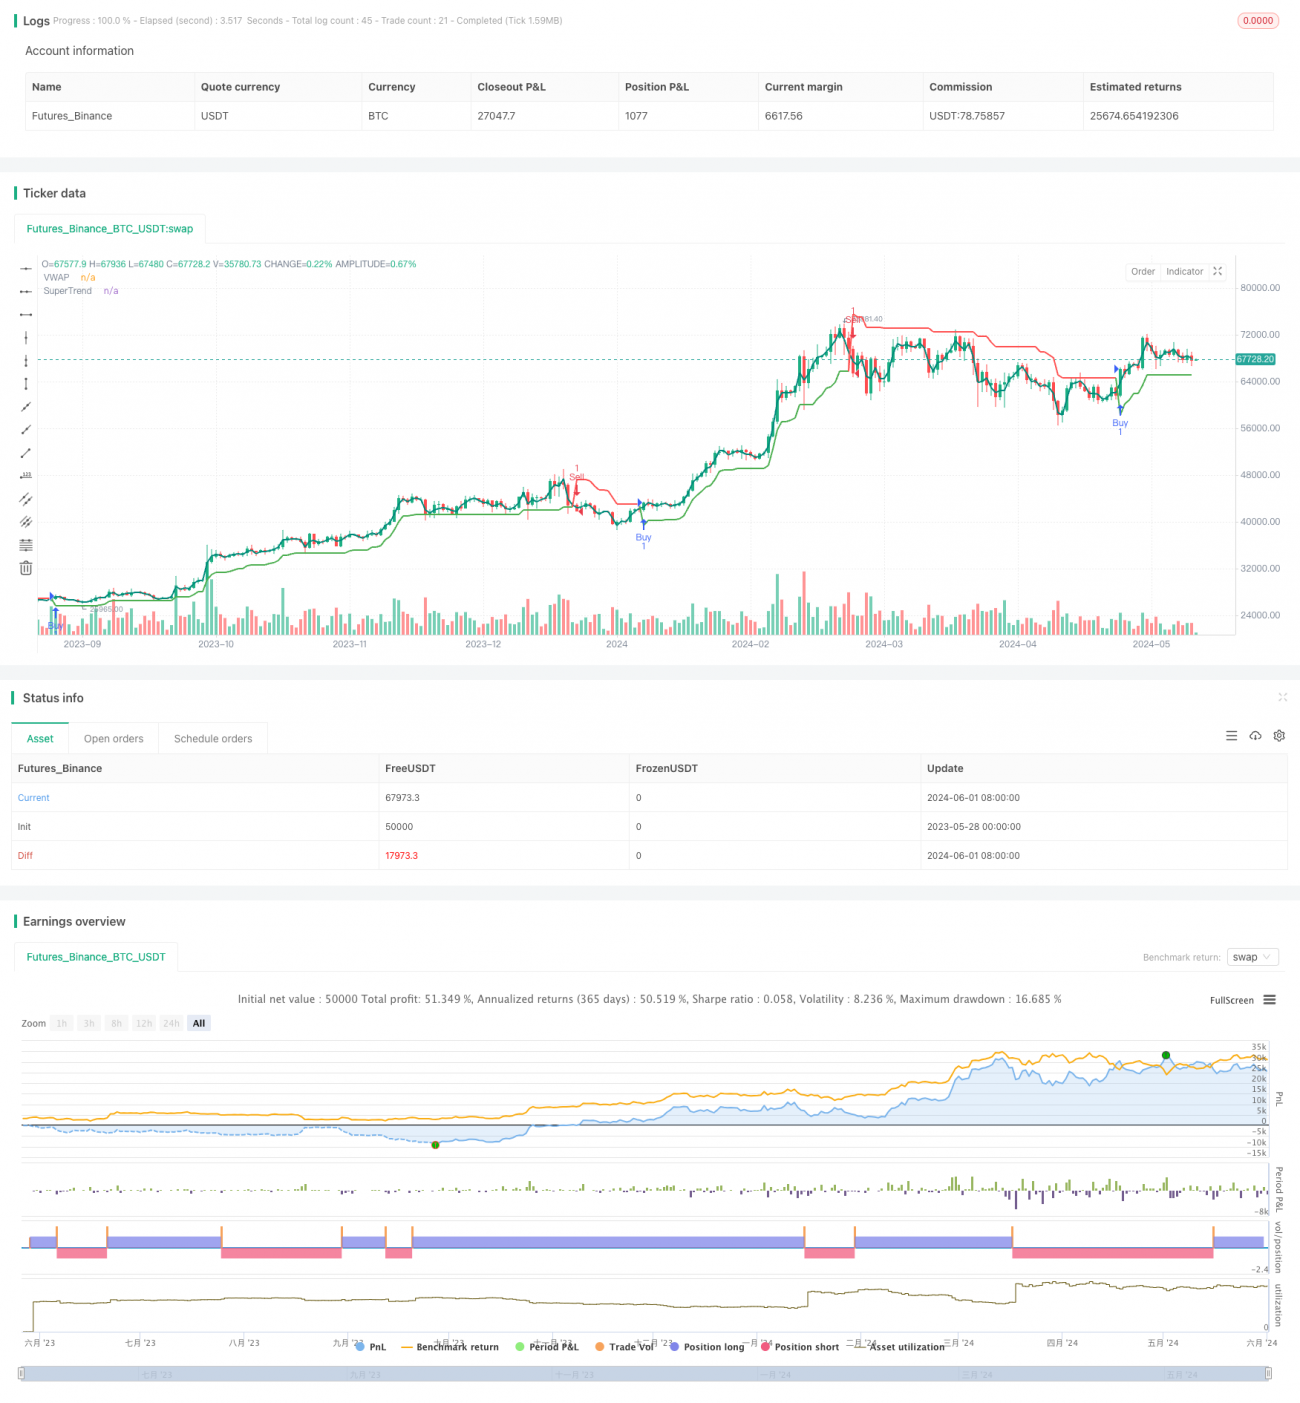
This strategy combines the VWAP (Volume Weighted Average Price) and Supertrend indicators. It determines buy and sell signals by comparing the price's position relative to the VWAP and the direction of the Supertrend indicator. A buy signal is generated when the price crosses above the VWAP and the Supertrend is positive, while a sell signal is generated when the price crosses below the VWAP and the Supertrend is negative. The strategy also avoids generating duplicate signals by recording the previous signal state until an opposite signal appears.
Strategy Principle
- Calculate the VWAP indicator using the ta.vwap function, with customizable VWAP length.
- Calculate the Supertrend indicator using the ta.supertrend function, with customizable ATR period and multiplier.
- Determine buy condition: current price crosses above VWAP and Supertrend direction is positive.
- Determine sell condition: current price crosses below VWAP and Supertrend direction is negative.
- Record the previous signal state to avoid consecutive signals in the same direction. A new trading signal is generated only when the current signal differs from the previous one.
Strategy Advantages
- Combines VWAP and Supertrend indicators for a more comprehensive assessment of market trends and potential turning points.
- The VWAP indicator considers volume, better reflecting the market's true movement.
- The Supertrend indicator has trend-following and oscillation-filtering characteristics, helping to capture major trends.
- The mechanism to avoid duplicate signals reduces trading frequency and lowers transaction costs.
Strategy Risks
- During periods of high market volatility or unclear trends, the strategy may generate more false signals.
- The strategy's performance depends on the choice of VWAP and Supertrend parameters; different settings may lead to different results.
- The strategy does not incorporate risk management and position sizing, which need to be combined with other measures to control risk in practical applications.
Strategy Optimization Directions
- Introduce a trend confirmation mechanism, such as using moving averages or other trend indicators, to further filter signals.
- Optimize parameter selection by backtesting historical data to find the best combination of VWAP length, ATR period, and multiplier.
- Implement risk management measures, such as stop-loss and take-profit, to control individual trade risk.
- Consider incorporating money management strategies, such as fixed fraction or Kelly Criterion, to optimize position sizing.
Summary
The VWAP and Supertrend Buy/Sell Strategy aims to comprehensively capture market trends and potential turning points by combining two different types of indicators. The strategy logic is clear and easy to implement and optimize. However, the strategy's performance depends on parameter selection and lacks risk management measures. In practical applications, further optimization and refinement are needed to adapt to different market conditions and trading requirements.
- 1