Buy/Sell Strategy Based on Volume & Candlestick Patterns

Overview
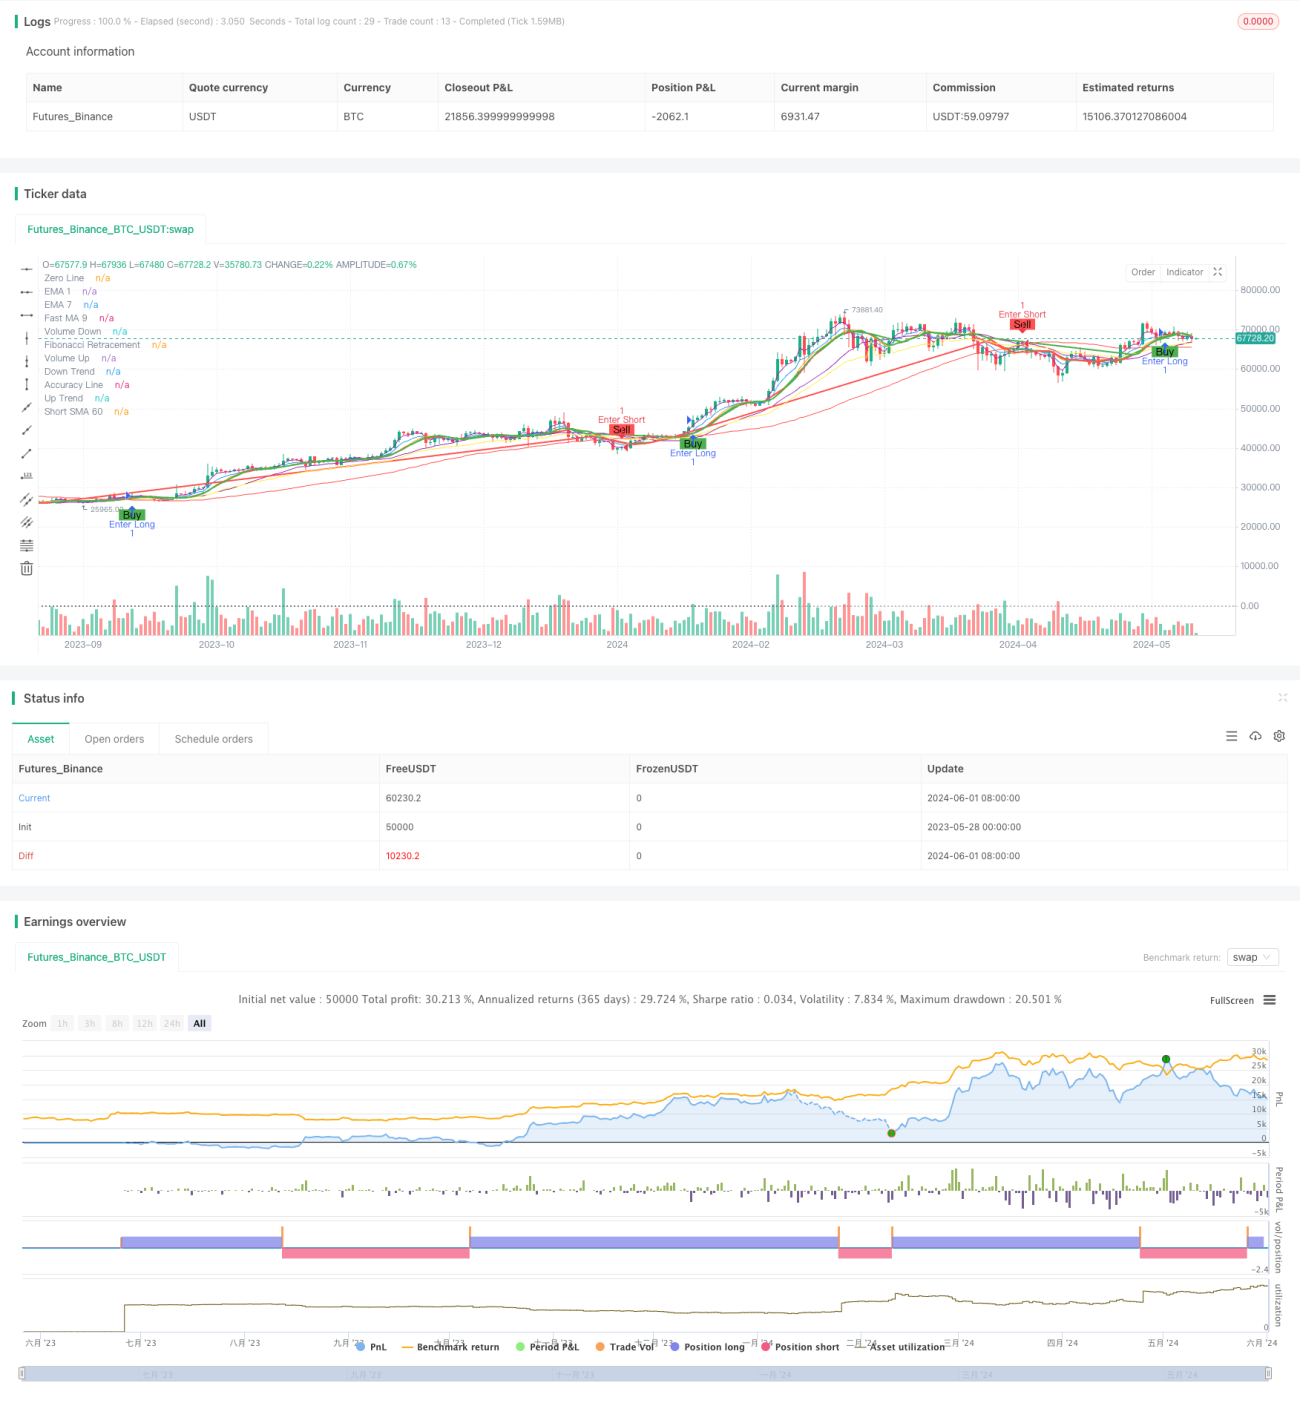
This strategy combines signals from price and trading volume, along with Fibonacci retracement levels, to generate buy and sell signals within the 15-minute and 45-minute timeframes. The strategy employs multiple moving averages (MAs) as indicators of trend and momentum, including Simple Moving Averages (SMAs) and Exponential Moving Averages (EMAs). Additionally, Fibonacci retracement levels are used as potential entry points. The primary objective of the strategy is to capture buying and selling opportunities promptly when significant changes in price and trading volume occur.
Strategy Principles
- Calculate the fast MA (default 10) and slow MA (default 30). When the fast MA is above the slow MA, it indicates an upward trend; otherwise, it indicates a downward trend.
- Calculate the volume MA (default 20). When the current volume is higher than the volume MA, it indicates an increase in volume; otherwise, it indicates a decrease in volume.
- Use multiple MAs and EMAs as auxiliary indicators, including the fast MA (default 9), short-term SMAs (default 10 and 60), and EMAs (default 3 and 7).
- Calculate Fibonacci retracement levels (0.47, 0.658, and 0.886) as potential support and resistance levels.
- Generate buy or sell signals when the short-term SMA (60) crosses the accuracy line (based on the crossover of the fast EMA and slow EMA).
- Generate exit signals when the fast MA (9) crosses the EMA (7).
Advantage Analysis
- Combines information from price and trading volume, providing a more comprehensive market analysis.
- Utilizes multiple MAs and EMAs as auxiliary indicators, helping to confirm changes in trend and momentum.
- Fibonacci retracement levels provide a reference for potential entry points, aiding in optimizing entry timing.
- Buy and sell signals are based on the crossover of the short-term SMA and accuracy line, helping to capture market turning points promptly.
- Exit signals are based on the crossover of the fast MA and EMA, aiding in timely profit-taking or stop-loss.
Risk Analysis
- In choppy markets, frequent crossover signals may lead to excessive trading and commission losses.
- The strategy relies on MAs and Fibonacci levels calculated from historical data, which may not adapt quickly to sudden market changes.
- The strategy lacks an assessment of the strength of market trends and may generate false signals when trends are weak.
- The strategy's parameters (such as MA periods) need to be optimized according to different market conditions; otherwise, the effectiveness of the strategy may be impacted.
Optimization Directions
- Introduce a trend strength indicator (such as ADX) to avoid trading or adopt a more conservative strategy when trends are weak.
- Optimize the period parameters of MAs and EMAs to adapt to different market conditions and trading instruments.
- Combine other technical indicators (such as RSI, MACD) to improve the reliability of signals.
- Introduce stop-loss and take-profit mechanisms to control the risk exposure of individual trades.
- For choppy markets, consider adopting more suitable trading strategies (such as range trading).
Summary
This strategy generates buy and sell signals within multiple timeframes by combining price, trading volume, and Fibonacci retracement levels. The strategy's advantage lies in its comprehensive consideration of multiple market elements and the use of multiple MAs and EMAs as auxiliary indicators. However, the strategy may generate excessive trading signals in choppy markets and relies on indicators calculated from historical data. Therefore, further optimization is needed to improve its adaptability and reliability. Optimization directions include introducing trend strength indicators, optimizing parameters, combining other technical indicators, and introducing risk management measures.
- 1