
Overview
This strategy utilizes indicators such as the Smooth Moving Average (SMA), Relative Strength Index (RSI), True Range (TR), and Volume Moving Average (Volume MA) in combination with trend filters, volume, and volatility conditions to execute trades when specific criteria are met. The main idea behind this strategy is to enter a long position when the price is below the SMA200, the trend is downward, and both volume and volatility are low. Stop loss and take profit levels are set upon entry. Additionally, the strategy incorporates an exception exit mechanism, closing the position when the RSI exceeds 70 or when the preset stop loss or take profit levels are reached.
Strategy Principles
- Calculate indicators such as SMA, RSI, Volume MA, and TR MA
- Determine if the current trend is upward or downward
- Check if the current volume and volatility are low
- Enter a long position when the price is below the SMA200 and the low volume and volatility conditions are met
- Set the stop loss at 95% and the take profit at 150% of the entry price
- Exit the trade when the RSI exceeds 70 or when the preset stop loss or take profit levels are reached
- Force close the position when the trend changes and the price breaks through the SMA
Advantage Analysis
- This strategy combines multiple technical indicators for a more comprehensive analysis of market conditions
- The trend filter and volume/volatility conditions help avoid trading in unfavorable market environments
- Setting clear stop loss and take profit levels effectively manages risk
- The exception exit mechanism allows for timely position closing in specific situations, preventing further losses
Risk Analysis
- The strategy's performance may be affected by the choice of parameter settings
- In some cases, the price may quickly reverse after triggering the entry condition, leading to losses
- The strategy does not consider fundamental factors and may be influenced by significant events
Optimization Directions
- Consider incorporating additional technical indicators such as MACD, Bollinger Bands, etc., to improve entry and exit accuracy
- Optimize the stop loss and take profit level settings, such as using trailing stops or dynamic take profit
- Dynamically adjust strategy parameters based on different market conditions
- Introduce a risk management module, including position sizing and money management
Summary
This strategy combines multiple technical indicators with trend filters, volume, and volatility conditions to execute trades in specific situations. By setting clear stop loss and take profit levels and implementing an exception exit mechanism, the strategy effectively manages risk. However, the strategy has certain limitations, as factors such as parameter selection and market anomalies may impact its performance. Future improvements can be made by incorporating more indicators, optimizing parameter settings, and adding risk management components.
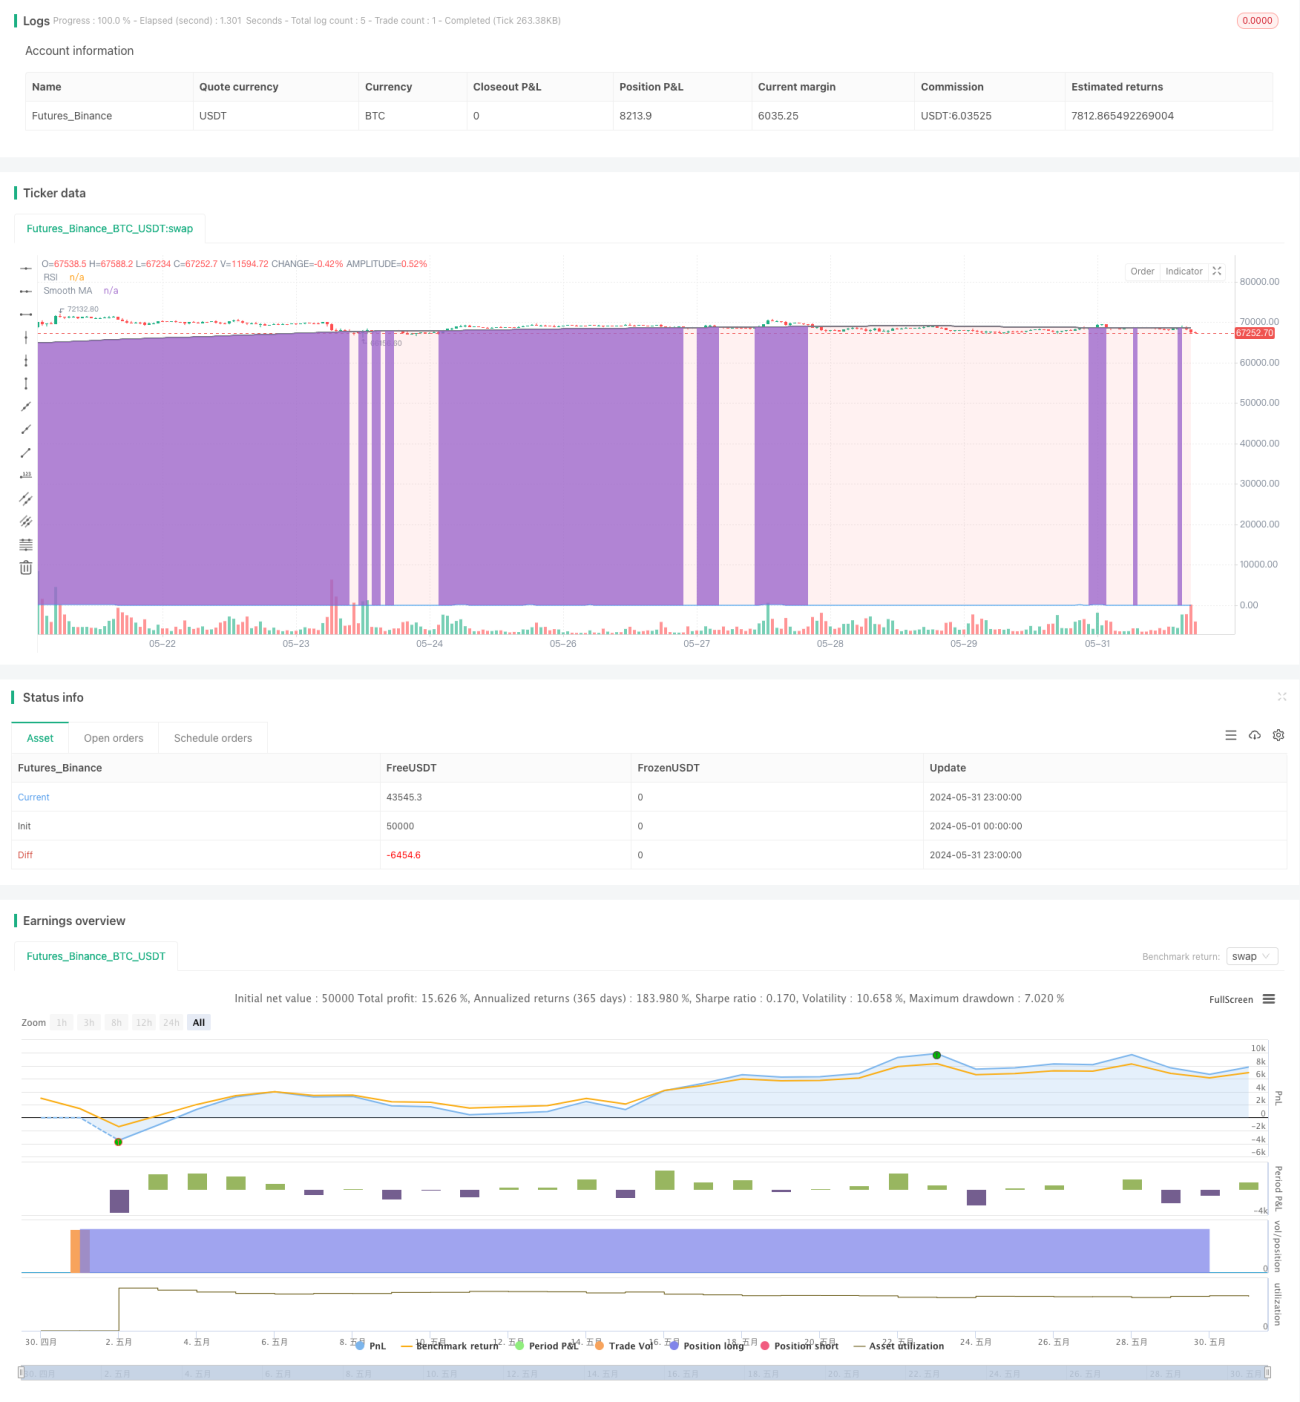
/*backtest
start: 2024-05-01 00:00:00
end: 2024-05-31 23:59:59
period: 1h
basePeriod: 15m
exchanges: [{"eid":"Futures_Binance","currency":"BTC_USDT"}]
*/

//@version=5
strategy("Strategia Stop Loss & Take Profit z Filtrem Trendu i Wyjątkiem", shorttitle="Smooth MA SL & TP with Exception", overlay=true)

// Parametry- 1