RSI, MACD, Bollinger Bands and Volume-Based Hybrid Trading Strategy

Overview
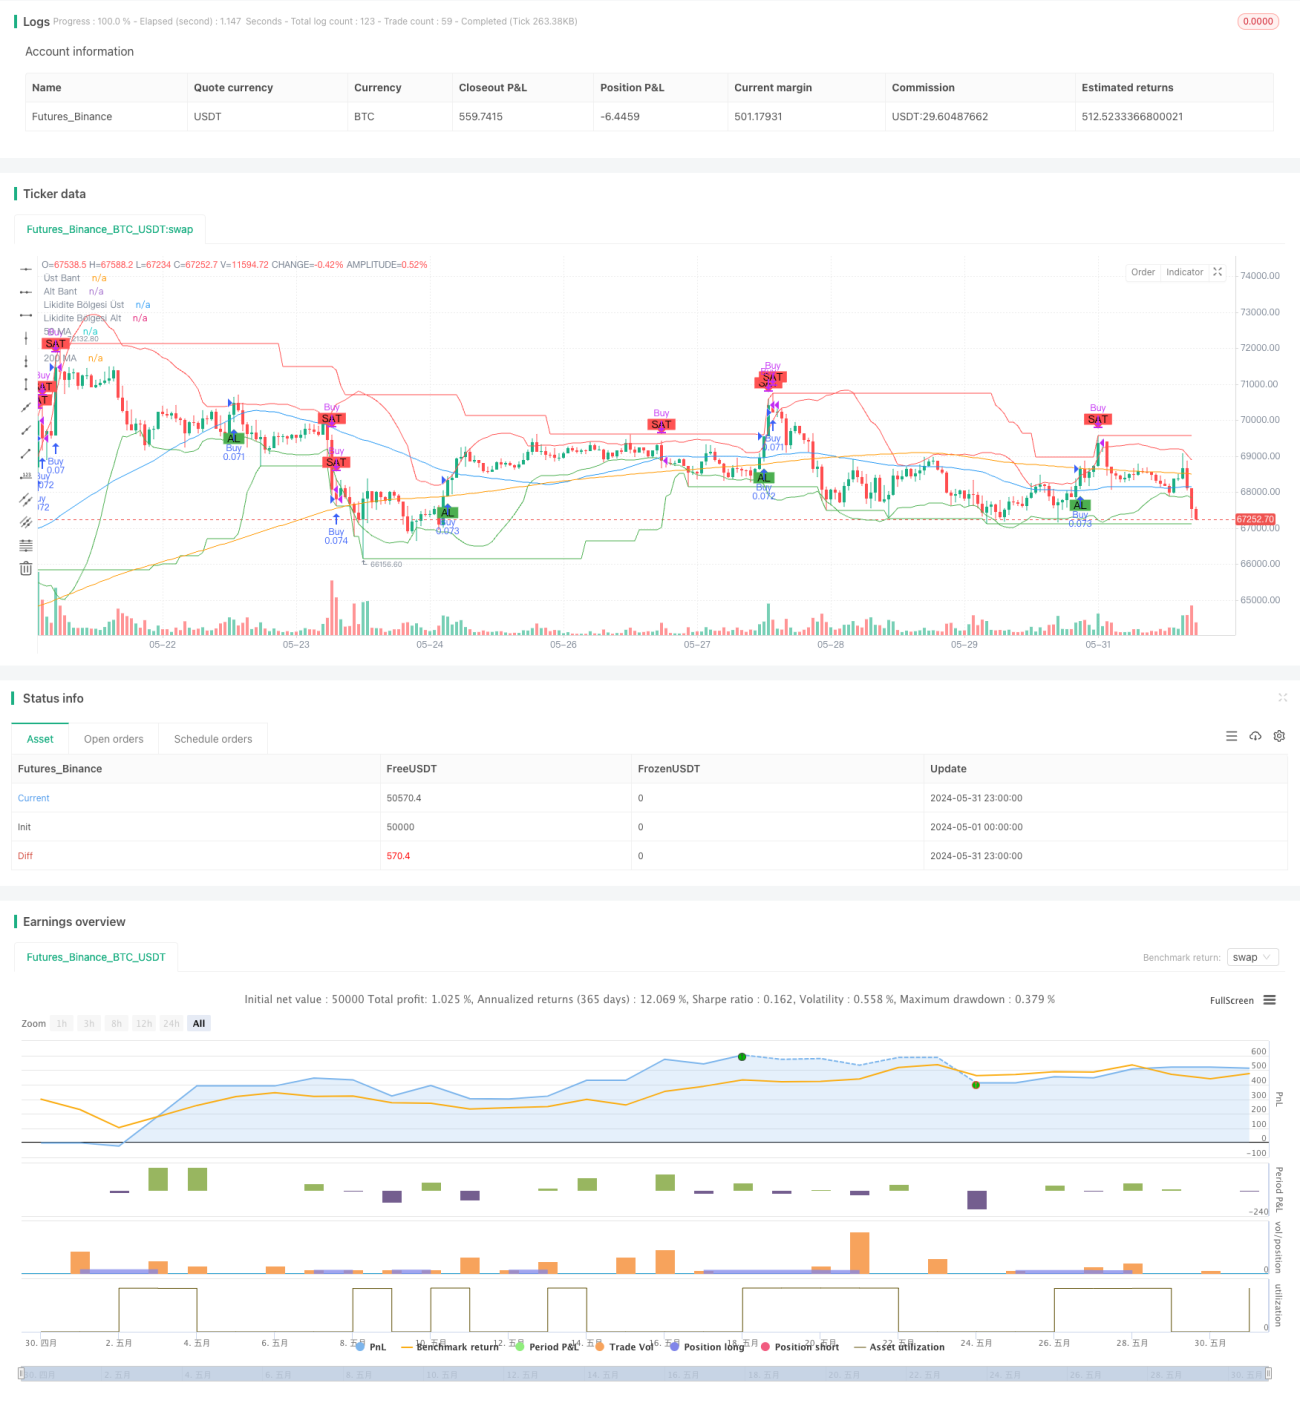
This strategy combines multiple technical indicators, including the Relative Strength Index (RSI), Moving Average Convergence Divergence (MACD), Bollinger Bands, and volume, to determine optimal trading opportunities. The strategy analyzes price and volume data to identify trends and volatility, and generates trading signals using momentum and volatility indicators. Additionally, the strategy introduces the concept of liquidity zones to further optimize trading signals.
Strategy Principles
- Calculate RSI, MACD, Bollinger Bands, and volume indicators.
- Use short-term and long-term moving averages to identify trend direction.
- Determine the high and low points of liquidity zones.
- Generate buy signals:
- Buy when RSI is below 30, the closing price is below the lower Bollinger Band, and it is above the low point of the liquidity zone.
- Buy when the MACD histogram is above 0, an uptrend is established, the closing price is higher than the highest point of the previous 10 candles, and it is above the low point of the liquidity zone.
- Buy when there is a spike in volume, the closing price is above the upper Bollinger Band, and it is above the low point of the liquidity zone.
- Generate sell signals:
- Sell when RSI is above 70, the closing price is above the upper Bollinger Band, and it is below the high point of the liquidity zone.
- Sell when the MACD histogram is below 0, a downtrend is established, the closing price is lower than the lowest point of the previous 10 candles, and it is below the high point of the liquidity zone.
- Sell when there is a spike in volume, the closing price is below the lower Bollinger Band, and it is below the high point of the liquidity zone.
- Execute trades based on buy and sell signals, avoiding duplicate trades.
Strategy Advantages
- Multi-indicator combination: The strategy considers multiple aspects, including price, volume, trends, and volatility, providing more reliable trading signals.
- Trend confirmation: By comparing short-term and long-term moving averages, the strategy effectively identifies the current trend direction.
- Volatility consideration: The introduction of Bollinger Bands and volume indicators allows the strategy to capture changes in price volatility and market sentiment.
- Liquidity zones: By determining liquidity zones, the strategy can execute trades near key support and resistance levels, increasing the success rate.
- Preventing over-trading: The strategy has a built-in mechanism to prevent duplicate trades, avoiding unnecessary trading costs.
Strategy Risks
- Parameter optimization risk: The performance of the strategy depends on the choice of multiple parameters, and improper parameter settings may lead to strategy failure.
- Market risk: The strategy is optimized based on historical data and may not perform well in the face of future market changes.
- Black swan events: The strategy cannot handle abnormal fluctuations under extreme market conditions.
- Slippage and trading costs: Slippage and trading costs in actual trading may affect the overall performance of the strategy.
Strategy Optimization Directions
- Dynamic parameter optimization: Dynamically adjust strategy parameters based on market conditions to adapt to different market stages.
- Risk management: Introduce stop-loss and take-profit mechanisms to control the risk exposure of individual trades.
- Multi-market testing: Apply the strategy to different financial markets to assess its universality and robustness.
- Machine learning optimization: Utilize machine learning algorithms to optimize the strategy and adapt to market changes.
Summary
This strategy combines multiple technical indicators, including RSI, MACD, Bollinger Bands, and volume, to form a comprehensive trading system. The strategy considers various aspects, such as price, trends, volatility, and market sentiment, and introduces the concept of liquidity zones to optimize trading signals. Although the strategy has certain advantages, it still faces challenges such as parameter optimization and market risks. In the future, the strategy can be further improved through dynamic parameter optimization, risk management, and machine learning methods.
/*backtest
start: 2024-05-01 00:00:00
end: 2024-05-31 23:59:59
period: 1h
basePeriod: 15m
exchanges: [{"eid":"Futures_Binance","currency":"BTC_USDT"}]
*/

//@version=5
strategy("Optimize Edilmiş Kapsamlı Ticaret Stratejisi - Likidite Bölgeleri ile 30 Dakika", overlay=true, default_qty_type=strategy.percent_of_equity, default_qty_value=10)

// Optimize edilebilir parametreler- 1