EMA Bullish Crossover Strategy

Overview
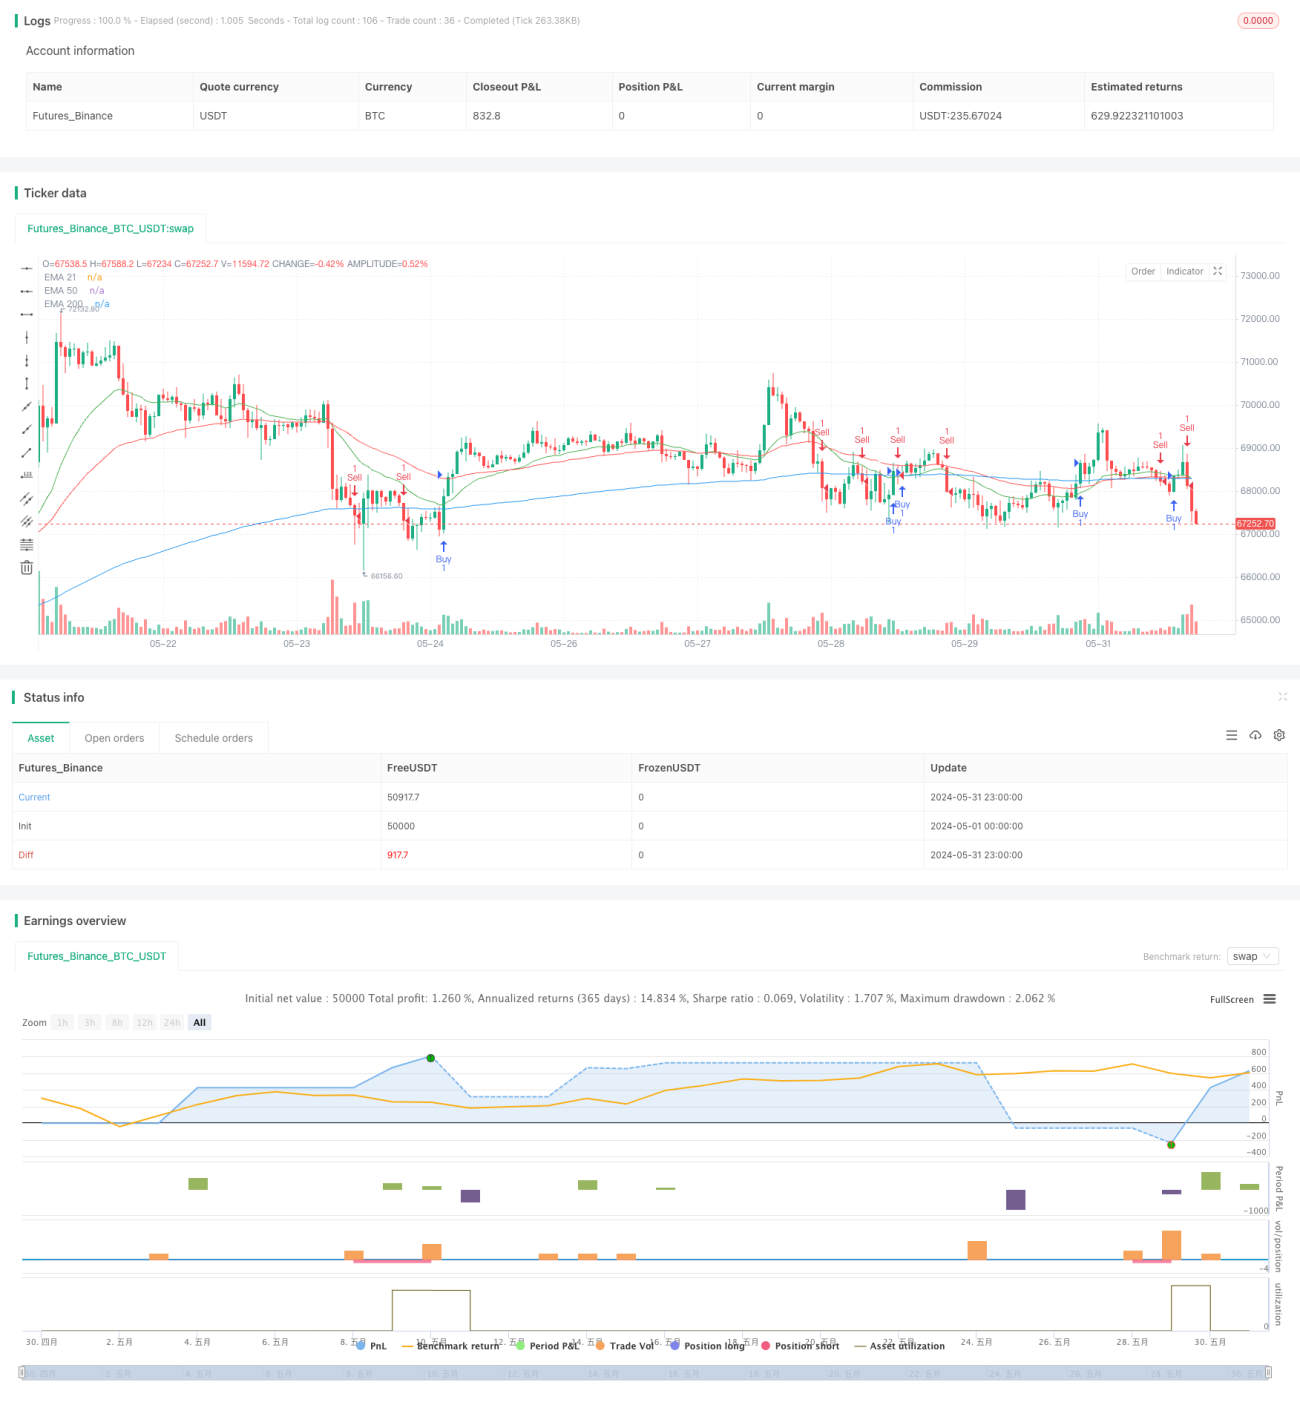
This strategy utilizes three exponential moving averages (EMAs) with different periods and the Relative Strength Index (RSI) to determine market trends and trading signals. A buy signal is generated when the price breaks above the 200-day EMA and the RSI is above 50, while a sell signal is generated when the price falls below the 200-day EMA and the RSI is below 50. The strategy is suitable for swing trading on the daily timeframe.
Strategy Principles
- Calculate the 200-day, 50-day, and 21-day EMAs, represented by blue, red, and green lines, respectively.
- Calculate the 14-period RSI.
- Generate a buy signal when the closing price crosses above the 200-day EMA and the RSI is above 50.
- Generate a sell signal when the closing price crosses below the 200-day EMA and the RSI is below 50.
- Position size is 1% of the account balance.
- For buy trades, the stop loss is set 50 points below the 200-day EMA, and the take profit is set 100 points above the entry price.
- For sell trades, the stop loss is set 50 points above the 200-day EMA, and the take profit is set 100 points below the entry price.
Strategy Advantages
- Combining price and momentum indicators helps capture trend formation and reversal timings.
- Three EMAs with different periods provide a comprehensive view of short, medium, and long-term trends, reducing signal frequency and false signals.
- RSI filters out trading signals in choppy markets, reducing losing trades.
- Fixed percentage position sizing helps control risk.
- Setting stop losses and take profits protects against single-trade risk.
Strategy Risks
- Signal lag at trend turning points may lead to partial profit loss.
- RSI signals may generate premature reverse signals in strong trends.
- Fixed percentage position sizing may be riskier in highly volatile markets.
- Stop loss levels too close to the 200-day EMA may result in frequent stop-outs.
Strategy Optimization Directions
- Introduce more medium and long-term moving average combinations to optimize signals.
- Consider RSI divergences and overbought/oversold conditions to adjust signals.
- Dynamically adjust position sizing based on volatility indicators like ATR.
- Optimize stop loss and take profit levels based on support/resistance levels, percentages, or ATR.
- Introduce trend filtering conditions, such as the ADX indicator, to avoid trading in choppy markets.
- Perform parameter optimization and backtesting validation for different instruments and timeframes.
Summary
By utilizing trading signals based on EMA bullish crossovers and RSI in the bullish zone, this strategy can capture relatively clear medium to long-term trend moves. However, its performance may be average during early trend reversals and choppy markets, making it more suitable for trending markets overall. Further optimizations can be made in terms of signals, position sizing, stop losses and take profits, and filtering conditions to improve the strategy's stability and risk-adjusted returns.
- 1