Dynamic Trend Following Strategy Combining Supertrend and EMA

Overview
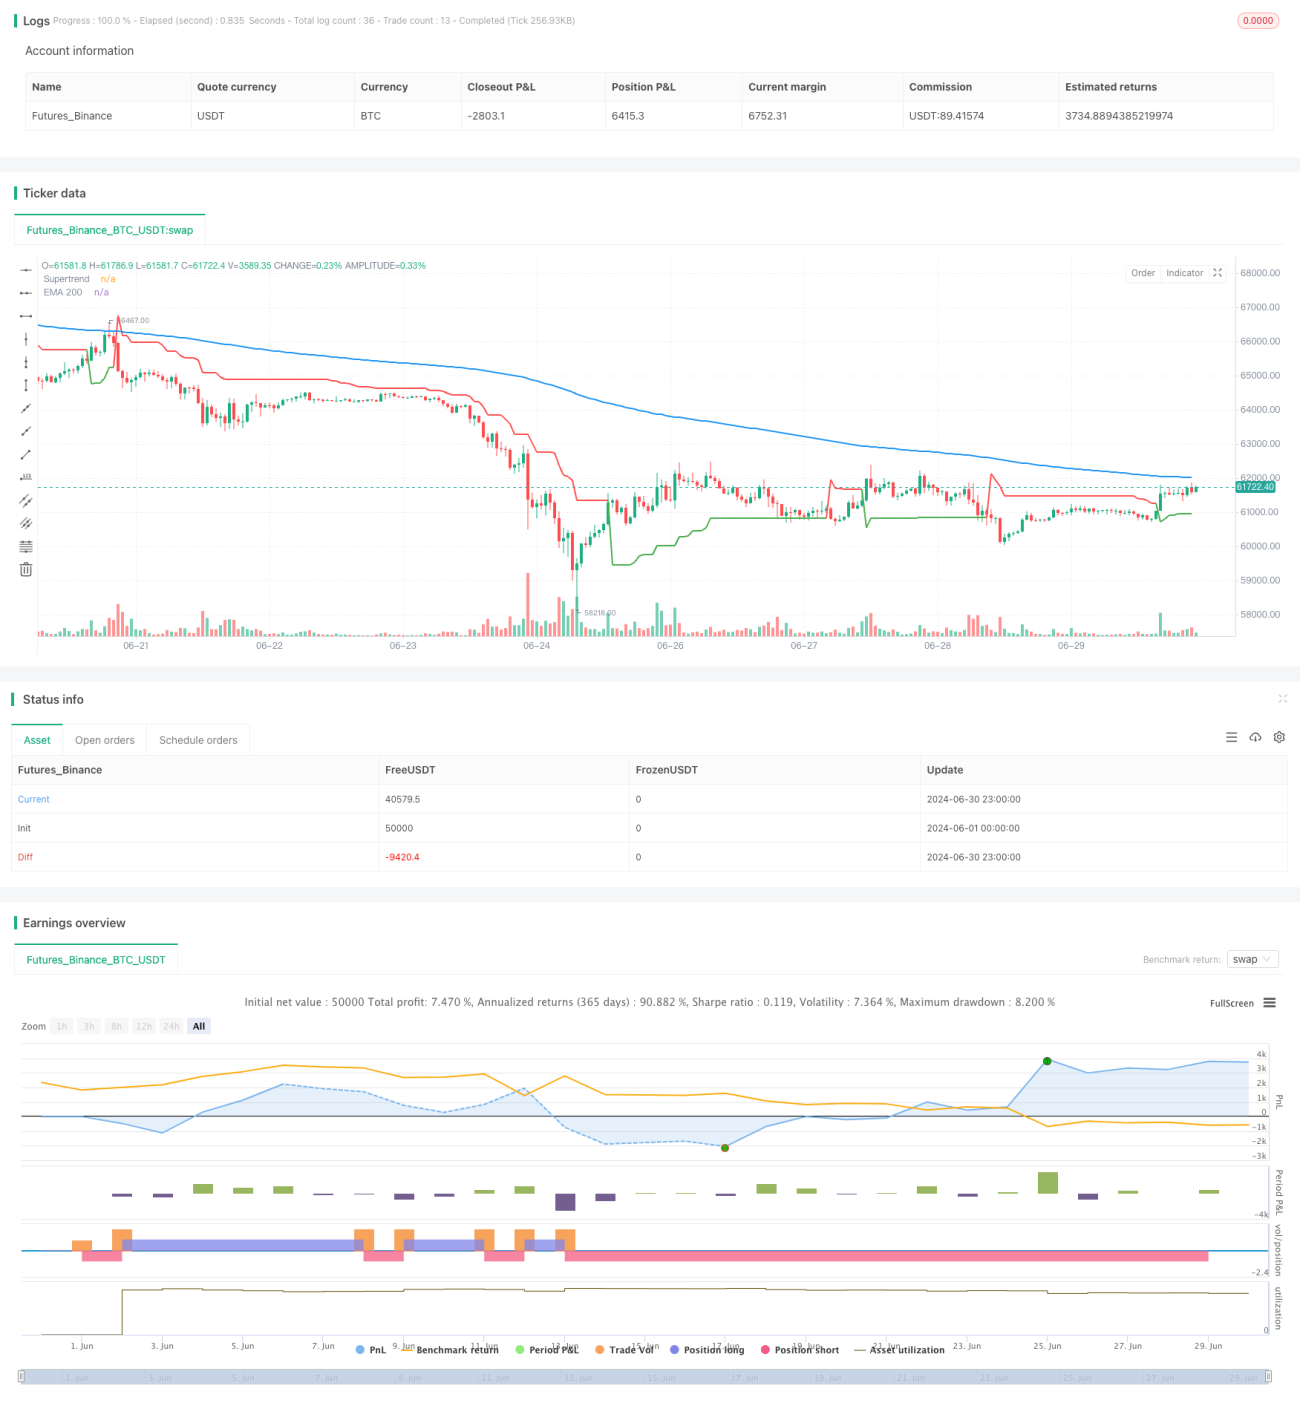
This strategy is a dynamic trend following trading system that combines the Supertrend indicator with the Exponential Moving Average (EMA). It utilizes the Supertrend indicator to capture changes in market trends while using the EMA 200 as a long-term trend filter. The strategy also incorporates Stop Loss (SL) and Take Profit (TP) mechanisms to manage risk and lock in profits. This approach aims to generate substantial returns in strong trending markets while reducing the risk of false breakouts in sideways or volatile markets.
Strategy Principles
-
Supertrend Indicator Calculation:
- Uses the Average True Range (ATR) to measure market volatility.
- Calculates upper and lower bands based on ATR and a user-defined factor.
- Dynamically adjusts the Supertrend line based on price relationship with the bands.
-
EMA 200 Calculation:
- Uses a 200-period Exponential Moving Average as a long-term trend indicator.
-
Trade Signal Generation:
- Long signal: When Supertrend turns bullish (green) and price is above EMA 200.
- Short signal: When Supertrend turns bearish (red) and price is below EMA 200.
-
Risk Management:
- Sets percentage-based stop loss and take profit levels for each trade.
- Closes existing positions when opposite trade signals occur.
-
Strategy Execution:
- Uses TradingView's strategy.entry function to execute trades.
- Implements strategy.close function to exit positions on signal reversal.
Strategy Advantages
-
Trend Capture Ability: The Supertrend indicator effectively identifies and follows market trends, potentially increasing profit opportunities.
-
Long-term Trend Confirmation: EMA 200 serves as an additional filter, helping to reduce counter-trend trades and improve trade quality.
-
Dynamic Adaptation: The strategy automatically adjusts to market volatility, adapting to different market conditions.
-
Risk Management: Integrated stop loss and take profit mechanisms help control risk and lock in profits, improving overall risk-reward ratios.
-
Long-Short Flexibility: The strategy can trade in both bullish and bearish markets, increasing profit opportunities.
-
Visualization: By plotting Supertrend and EMA lines on charts, traders can visually understand market conditions and strategy logic.
Strategy Risks
-
False Breakouts: In sideways markets, frequent false breakout signals may lead to overtrading and losses.
-
Lag: EMA 200 is a lagging indicator, potentially missing trading opportunities at the beginning of trend reversals.
-
Rapid Reversals: In severe market fluctuations, stop losses may not execute effectively, leading to larger losses.
-
Parameter Sensitivity: Strategy performance highly depends on parameter settings such as ATR length, factor, and EMA period.
-
Market Adaptability: The strategy may perform well under certain market conditions but poorly under others.
-
Over-optimization: Adjusting parameters to fit historical data may lead to over-optimization, affecting future performance.
Strategy Optimization Directions
-
Dynamic Parameter Adjustment:
- Implement adaptive adjustment of ATR length and factor to suit different market volatilities.
- Explore using shorter-period EMAs as auxiliary confirmation indicators.
-
Multi-timeframe Analysis:
- Incorporate trend information from higher timeframes to improve trading decision accuracy.
-
Volume Filtering:
- Add volume indicators to confirm trend strength and reduce false breakouts.
-
Optimize Entry Timing:
- Implement pullback entry logic to find better entry points after trend establishment.
-
Improve Risk Management:
- Implement dynamic stop losses, such as trailing stops or ATR-based stops.
- Explore partial profit-taking strategies, closing part of the position at certain profit targets.
-
Market State Classification:
- Develop algorithms to identify current market states (trending, ranging) and adjust strategy parameters accordingly.
-
Machine Learning Integration:
- Use machine learning algorithms to optimize parameter selection and signal generation.
-
Backtesting and Validation:
- Conduct extensive backtesting across different markets and time ranges to assess strategy robustness.
- Implement walk-forward analysis to reduce the risk of over-optimization.
Summary
The dynamic trend following strategy combining Supertrend and EMA is a comprehensive trading system designed to capture market trends and manage risk. By combining the dynamic nature of Supertrend with the long-term trend confirmation of EMA 200, the strategy provides a reliable trading framework. The integrated stop loss and take profit mechanisms further enhance risk management capabilities.
However, like all trading strategies, it is not without risks. Issues such as false breakouts, parameter sensitivity, and market adaptability need careful consideration and management. Through continuous optimization and improvement, such as implementing dynamic parameter adjustments, multi-timeframe analysis, and advanced risk management techniques, the strategy's performance and robustness can be further enhanced.
Ultimately, this strategy provides traders with a powerful starting point that can be customized and improved based on individual trading styles and risk tolerance. By deeply understanding the strategy's strengths and limitations, traders can make informed decisions to effectively manage risk while pursuing profits.
- 1