Adaptive Oscillation Trend Trading Strategy with Bollinger Bands and RSI Integration

Overview
This strategy is a trend-following system that combines multiple technical indicators, utilizing Bollinger Bands, RSI, and MACD to capture trading opportunities during market oscillations and trend transitions. The strategy employs a pyramiding position sizing approach with strict trade interval controls for risk management.
Strategy Principles
The core logic is built on triple signal confirmation:
- RSI identifies oversold (<45) and overbought (>55) zones
- Bollinger Bands determine price position, generating signals when price approaches or breaches the bands
- MACD crossovers confirm trends, triggering trades when aligned with RSI and Bollinger Band signals
The strategy implements a minimum trade interval (15 periods) to prevent overtrading and uses pyramiding position management.
Strategy Advantages
- Multiple technical indicator cross-validation reduces false signals
- Pyramiding mechanism improves capital efficiency
- Minimum trade interval effectively controls trading frequency
- Adjustable indicator parameters provide strong adaptability
- Automated position closure mechanism controls risk exposure
Strategy Risks
- Multiple indicators may lead to signal lag
- Potential frequent trading in oscillating markets
- Pyramiding positions may result in larger losses during trend reversals
- Fixed RSI thresholds may not suit all market conditions
Optimization Directions
- Implement adaptive RSI thresholds based on market volatility
- Incorporate volume indicators for signal confirmation
- Optimize pyramiding position sizing algorithm
- Add more flexible stop-loss mechanisms
- Consider market cycle characteristics for dynamic trade interval adjustment
Summary
The strategy achieves stable returns while controlling risk through the coordination of multiple technical indicators. Despite some inherent lag, the strategy demonstrates good adaptability and stability through proper parameter optimization and risk management mechanisms. Future improvements can focus on introducing adaptive mechanisms and enhanced position management to further improve strategy performance.
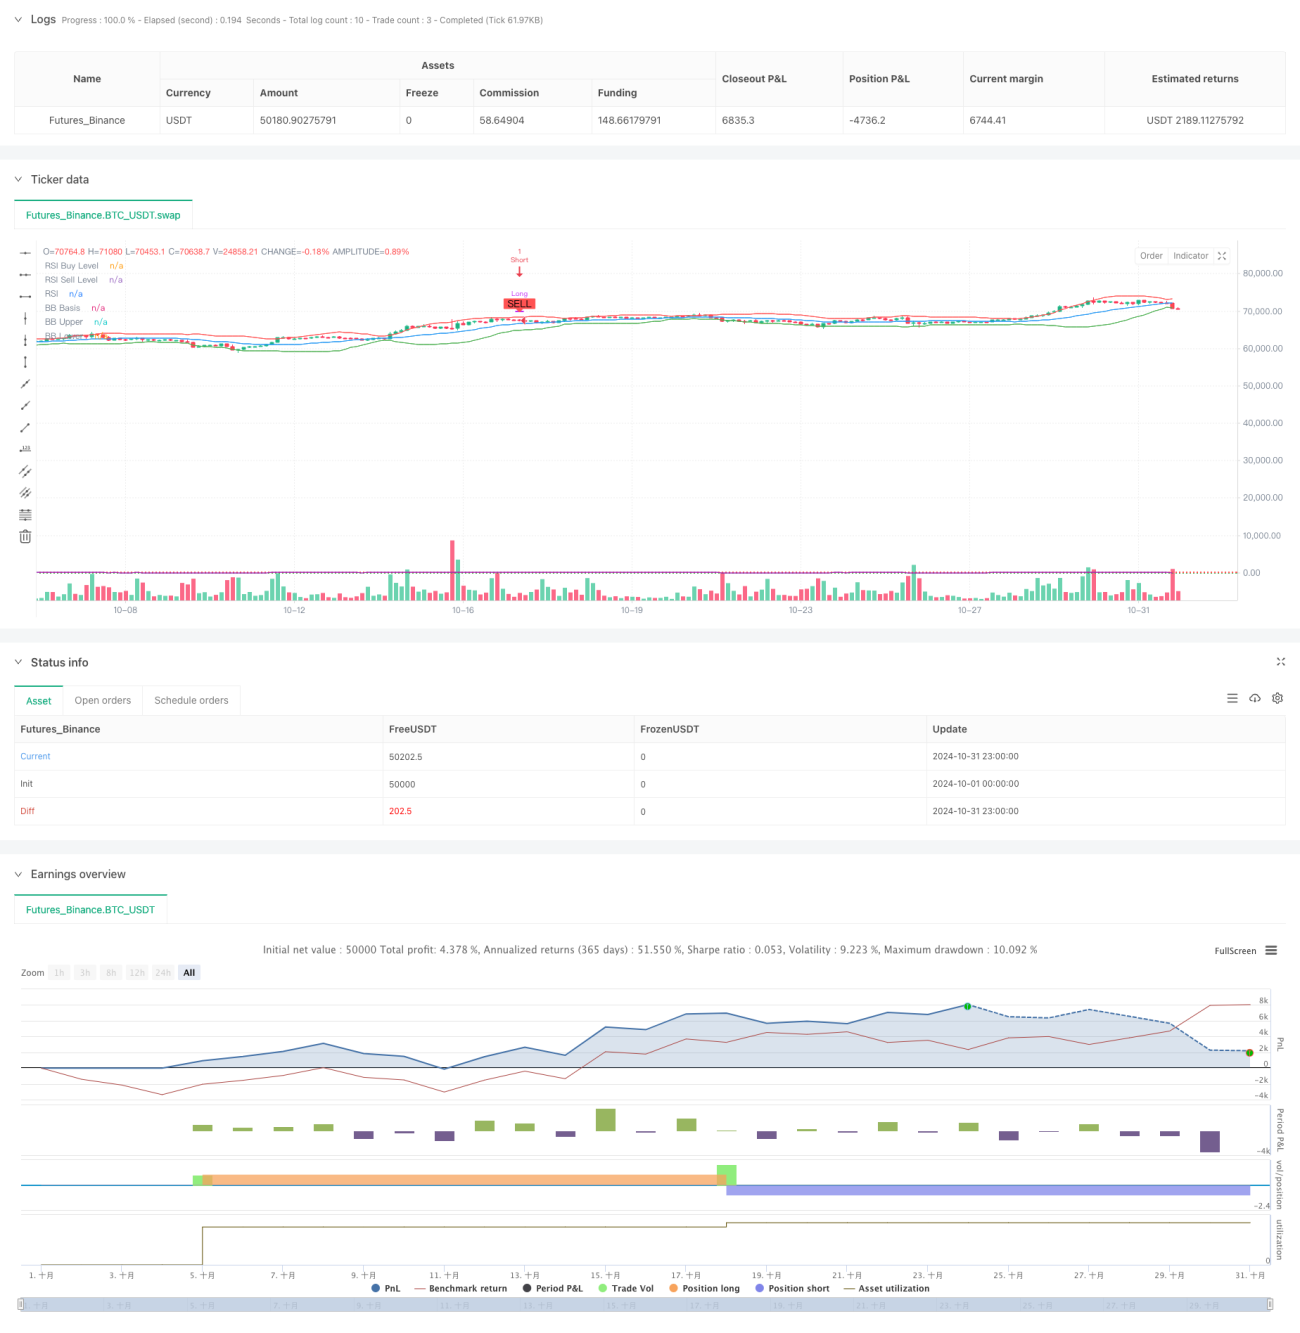
/*backtest
start: 2024-10-01 00:00:00
end: 2024-10-31 23:59:59
period: 3h
basePeriod: 3h
exchanges: [{"eid":"Futures_Binance","currency":"BTC_USDT"}]
*/

//@version=5
strategy("[ETH] Optimized Trend Strategy", shorttitle="Lorenzo-SuperScalping", overlay=true, pyramiding=3, initial_capital=100000, currency=currency.USD)

// === Input Parameters === //- 1